HOW TO SIMULATE THE UNIVERSE IN 134 EASY STEPS
This is the text version of a talk I gave on April 2016 at OpenVisConf,
a gathering for art/tech peeps who do data visualization.
(the fancy term for "making graphs")
Here's the recorded video!
Here's the recorded video!
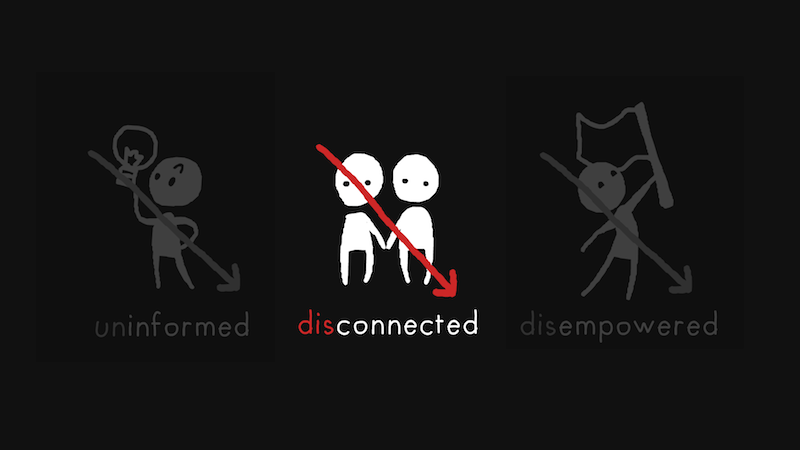
Introduction
|
Part A: (Un)informed
|
Part B: (Dis)connected
|
Part C: (Dis)empowered
|
Tools for Systems Storytelling
|
The End
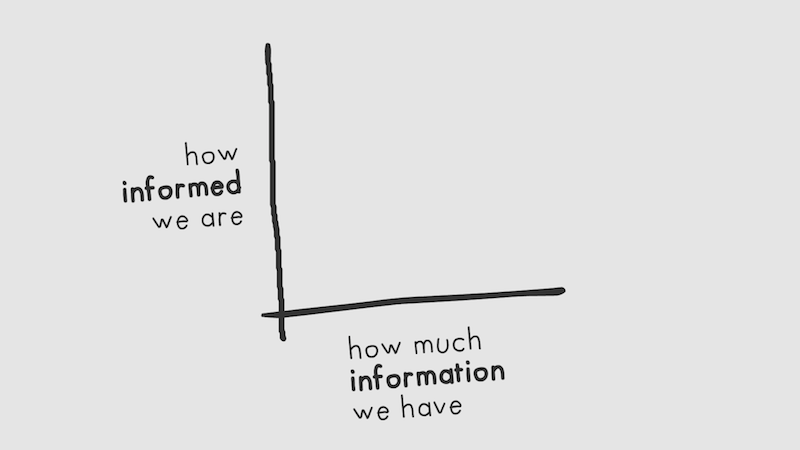
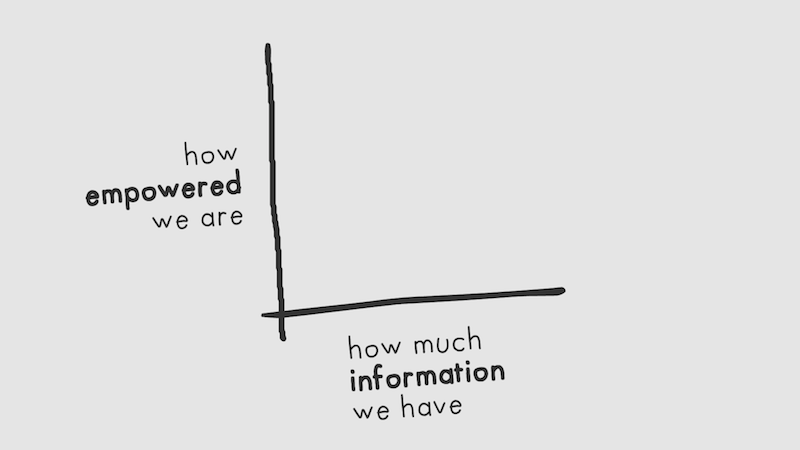
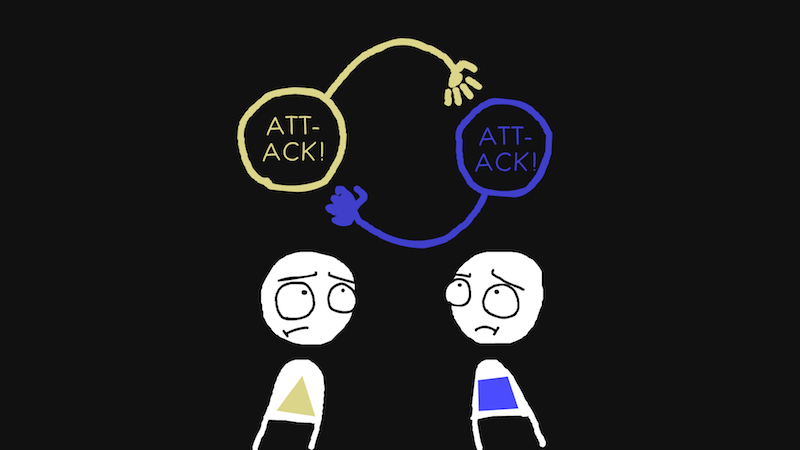
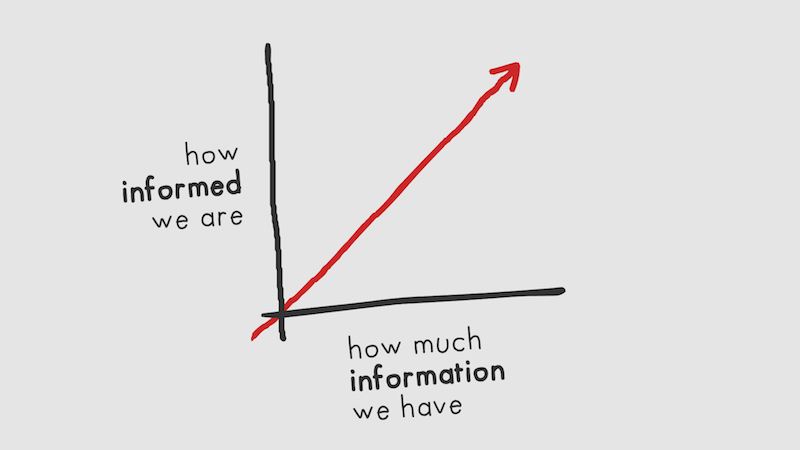
So... I heard you like graphs.
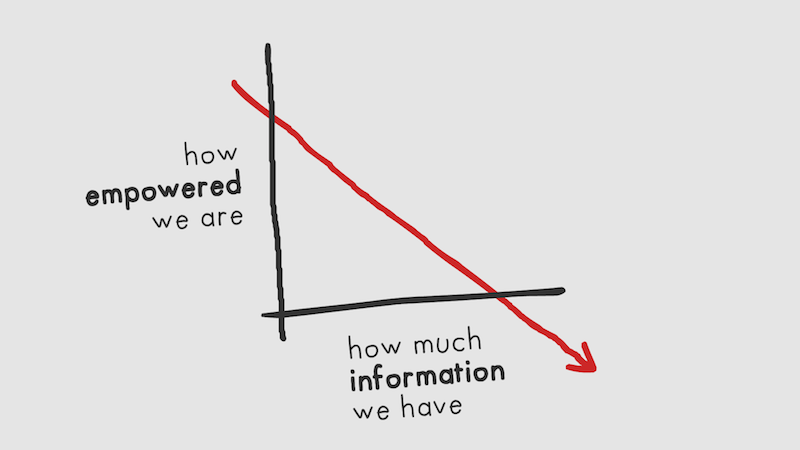
Well, here's a completely made-up graph based off an unscientific survey of two anecdotes! How informed we are, versus how much information we have. Obviously, the more information we have...
[laughter]
Well, here's a completely made-up graph based off an unscientific survey of two anecdotes! How informed we are, versus how much information we have. Obviously, the more information we have...
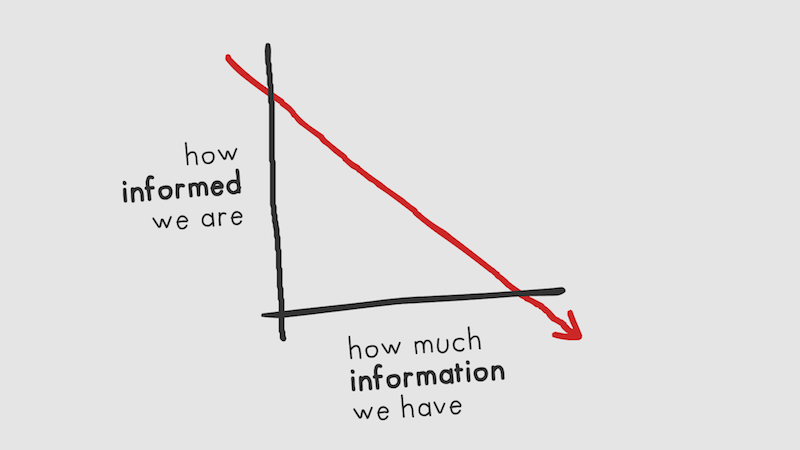
...the less informed we are,
because now there's too much noise, not enough signal.
Too much haystack, not enough needle.
We can't tell what really matters anymore.
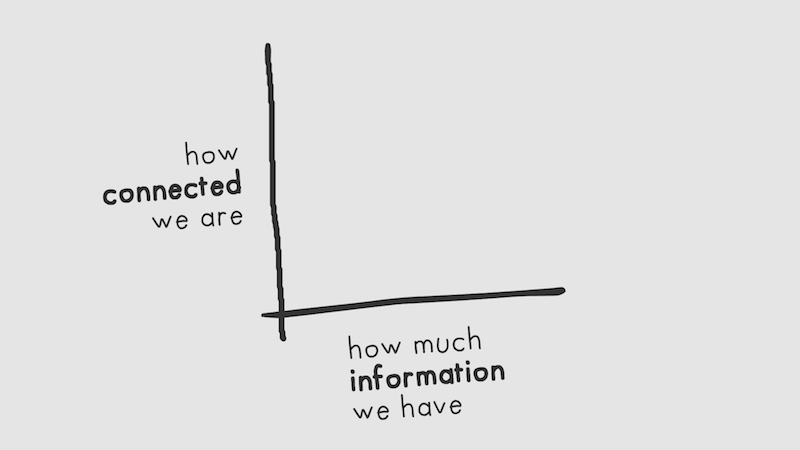
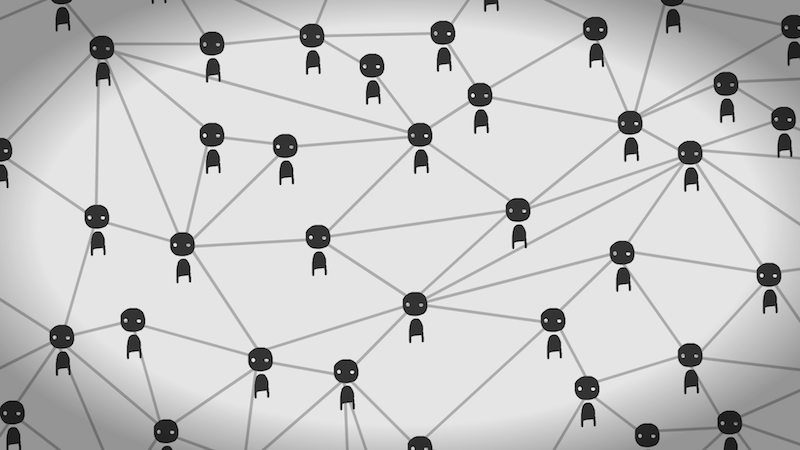
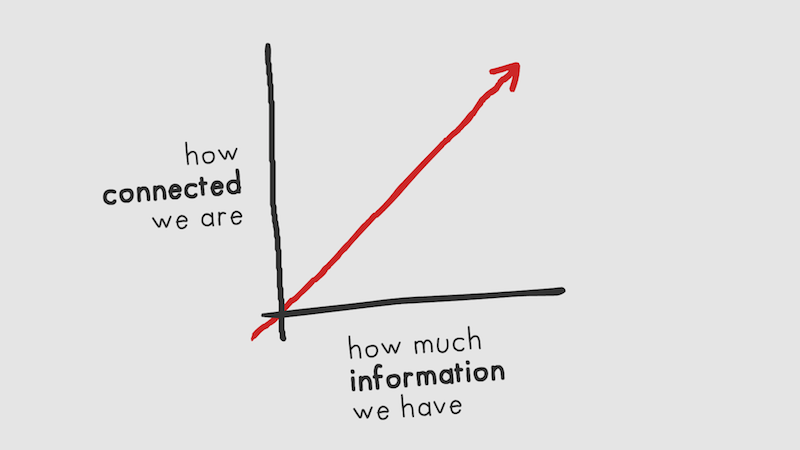
Here's another graph.
How connected we are, versus how much information we have. Again, obviously, the more information we have...
How connected we are, versus how much information we have. Again, obviously, the more information we have...
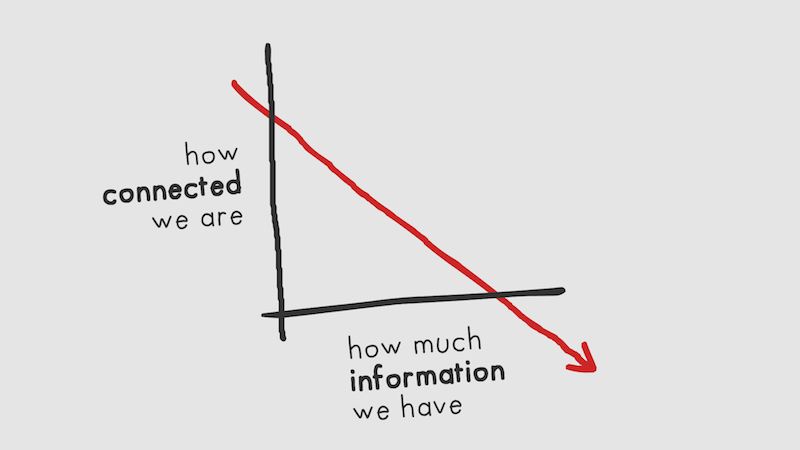
...the less connected we are, because now with the internet,
you can find whatever information that already confirms
your pre-existing biases & beliefs. More information is making
us more polarized.
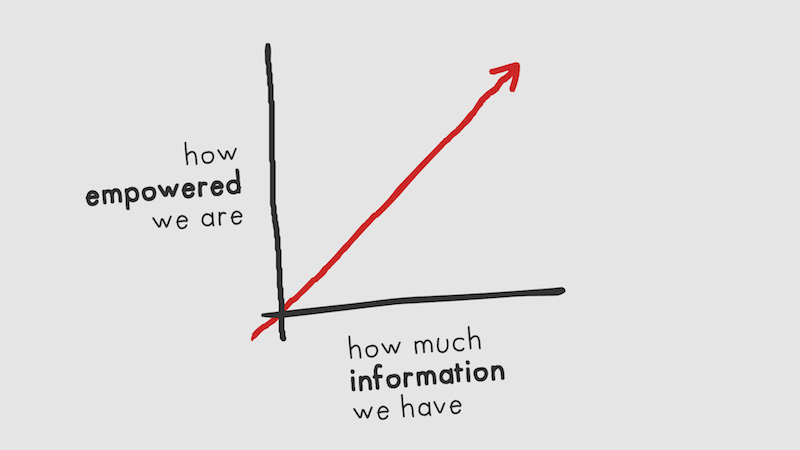
Here's another another graph.
How empowered we are, versus how m--
How empowered we are, versus how m--
Let's just skip to the punchline.
The more you learn, the more you realize everything's awful.
It's all too complex, and out of your control!
You can't do anything about it.

So. I heard you like graphs.
That's why we're here at this conference, isn't it? Because we like to make visualizations and interactives, to make information more accessible. We're doing this because we want to make people...
That's why we're here at this conference, isn't it? Because we like to make visualizations and interactives, to make information more accessible. We're doing this because we want to make people...

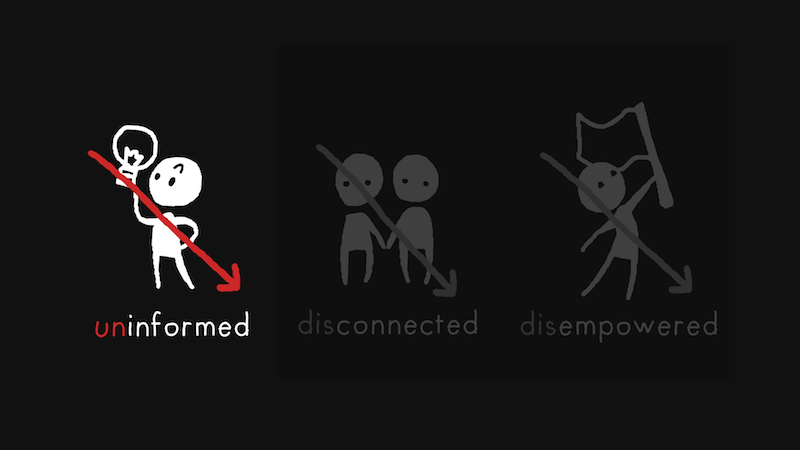
...more informed,
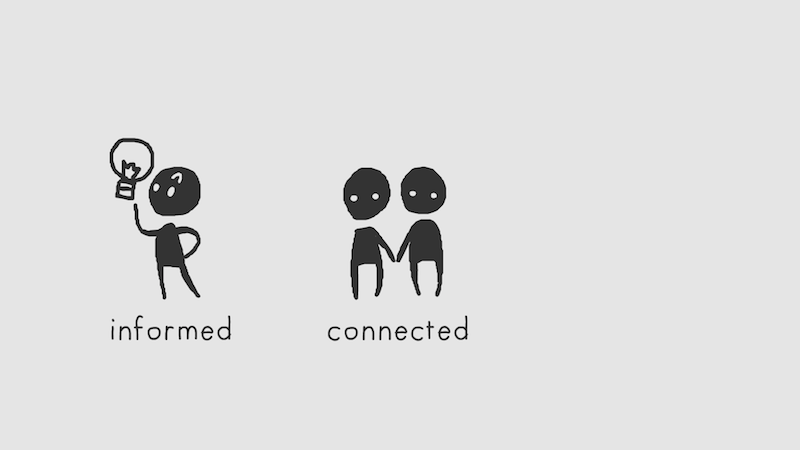
...more connected,
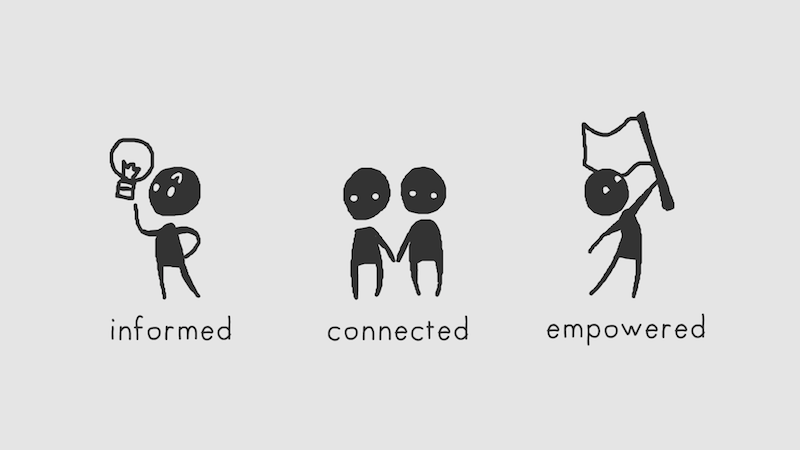
...and more empowered,
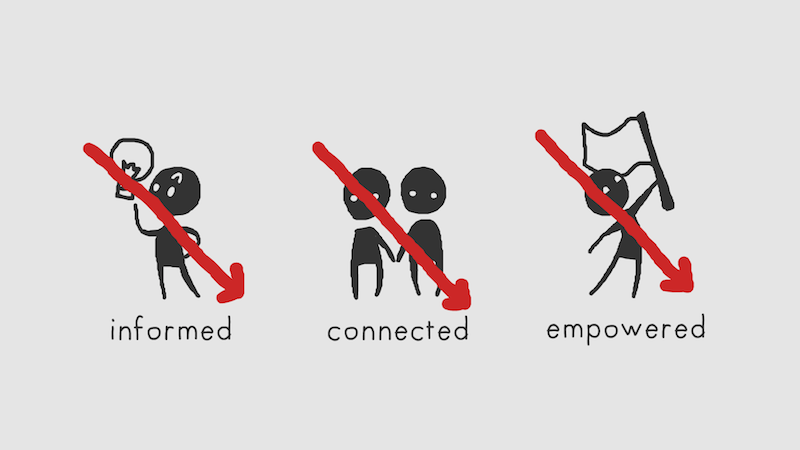
but if what we do – pumping more and more information out there –
accomplishes the complete opposite of that?...
Then, well, the question for us media-makers and journalists
in the internet age is not “can our field survive”, but
“does our field deserve to survive.”
That is our existential crisis.
That is our existential crisis.

[unsettled laughter]

Seriously though, it's a big problem.
But to be fair, data visualization already solves half the issue.
Because dataviz lets us go from individual stories...
...to the larger patterns.
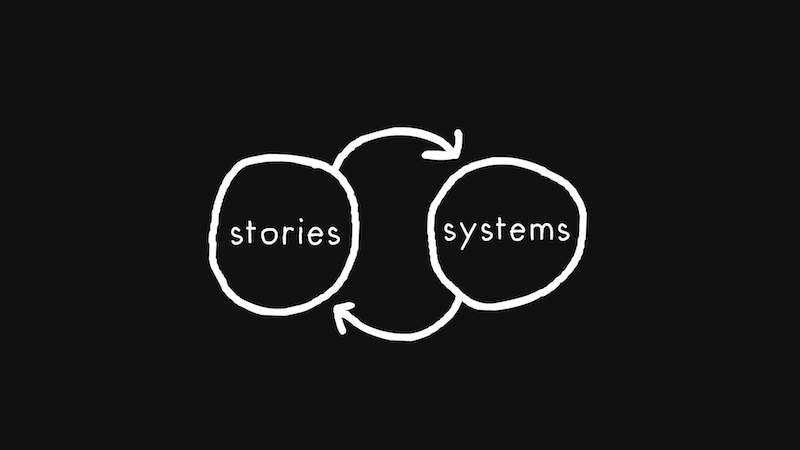
But I think it's time for us to go deeper. Because if what's under those stories are patterns, what's under those patterns...
But I think it's time for us to go deeper. Because if what's under those stories are patterns, what's under those patterns...

One tool I think might help is simulation.
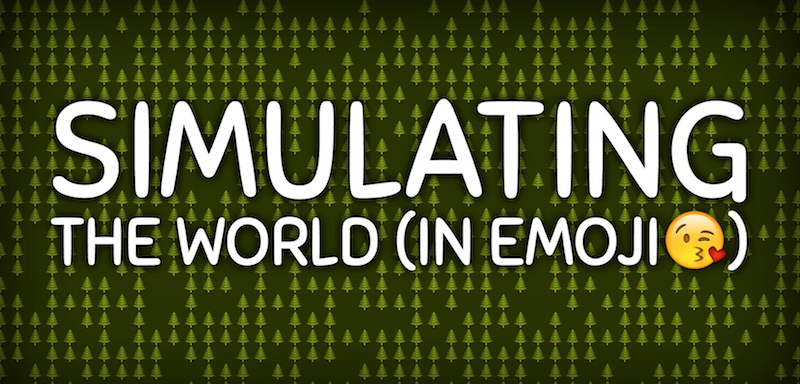
Here's a project I made a few months ago, Simulating The World (In Emoji 😘)
On it, readers can play with a bunch of simulations, change the rules, and even create their own simulation! These sims teach a variety of systems, such as...
Here's a project I made a few months ago, Simulating The World (In Emoji 😘)
On it, readers can play with a bunch of simulations, change the rules, and even create their own simulation! These sims teach a variety of systems, such as...
Ecosystems, and why forest fires are actually good for the forest.
this is a looping video! click the play button to start it.
Epidemiology, how disease spreads, what herd immunity is, and why it's important.
this one's a looping video, too.
[a "huh." from the audience]
Finally, civic conflict.
And how, much like wildfire or disease,
violence can spread quickly throughout a population.
Now, of course, these sims aren't gonna be complicated. It's in emoji. They're going to be very simplified.
But that's not a bug... it's a feature!
same.
Now, of course, these sims aren't gonna be complicated. It's in emoji. They're going to be very simplified.
But that's not a bug... it's a feature!
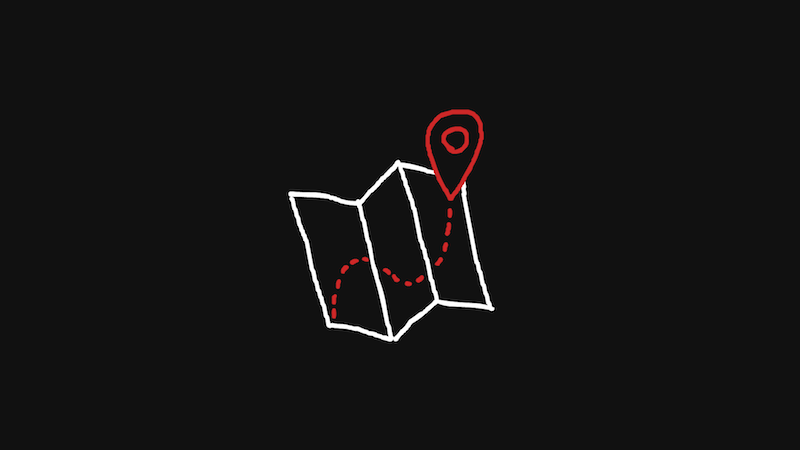
Think of a street map.
A street map is useful not despite being simplified, but because it's simplified. That's the power of models and simulations – they cut away what doesn't matter, to clearly show what does.
A street map is useful not despite being simplified, but because it's simplified. That's the power of models and simulations – they cut away what doesn't matter, to clearly show what does.
And that's the problem.
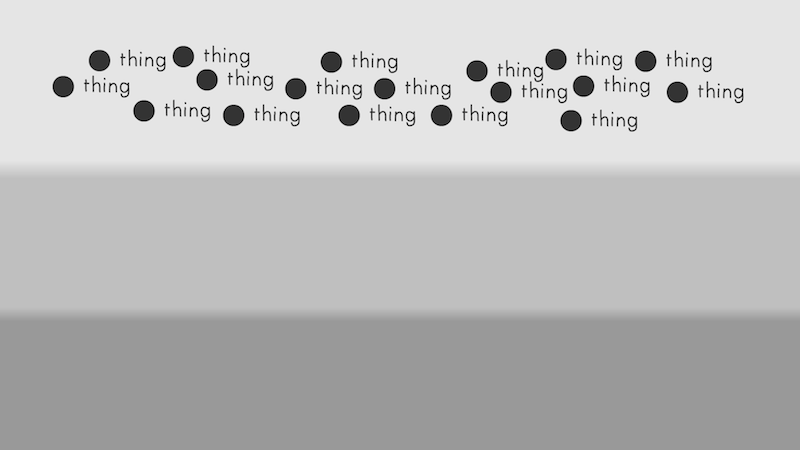
Too many things in our news and media just do not matter.
Or worse, they give people the entirely wrong impression.
For example, turn on your local cable news, and you're bound to get a nasty, gnarly, gruesome crime story. If that's the story you keep seeing, you'd think that crime is skyrocketing. And that is the US public perception nowadays.
For example, turn on your local cable news, and you're bound to get a nasty, gnarly, gruesome crime story. If that's the story you keep seeing, you'd think that crime is skyrocketing. And that is the US public perception nowadays.
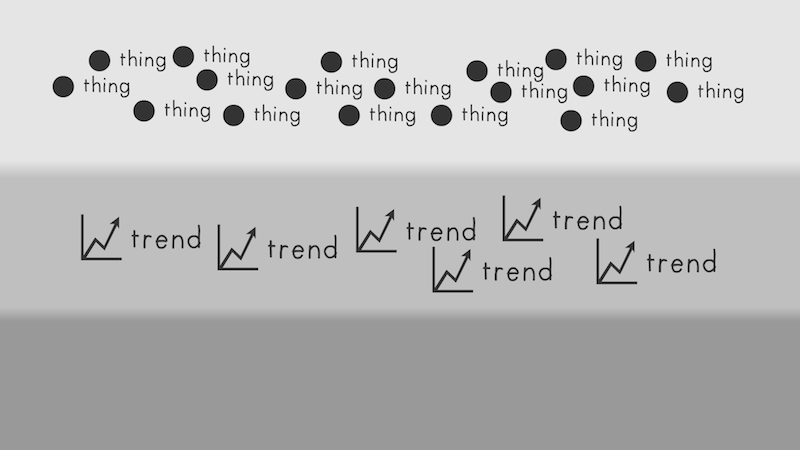
But if you look at the trends,
you'll see that crime has been falling in the US since the 80's.
But the trends only tell you that crime has fallen,
but not why.
For that, you need to go beyond the things and trends, and down to...
For that, you need to go beyond the things and trends, and down to...
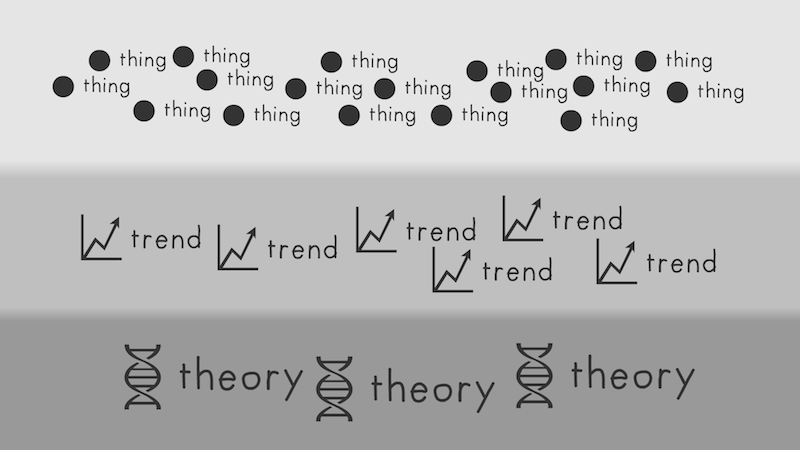
...the theory.
Sociology, criminology, psychology, economics, so on and so forth. Once you have theory, then you can design a more humane criminal justice system.
Trends only let us extrapolate to the future. Theory lets us create the future.
Sociology, criminology, psychology, economics, so on and so forth. Once you have theory, then you can design a more humane criminal justice system.
Trends only let us extrapolate to the future. Theory lets us create the future.
But, like Inception, we gotta go deeper.
Is there something deeper, that underlies all the theories we have? I think, yes!
I mean – other than philosophy and mathematics and language and logic and the scientific method itself, there's also...
Is there something deeper, that underlies all the theories we have? I think, yes!
I mean – other than philosophy and mathematics and language and logic and the scientific method itself, there's also...
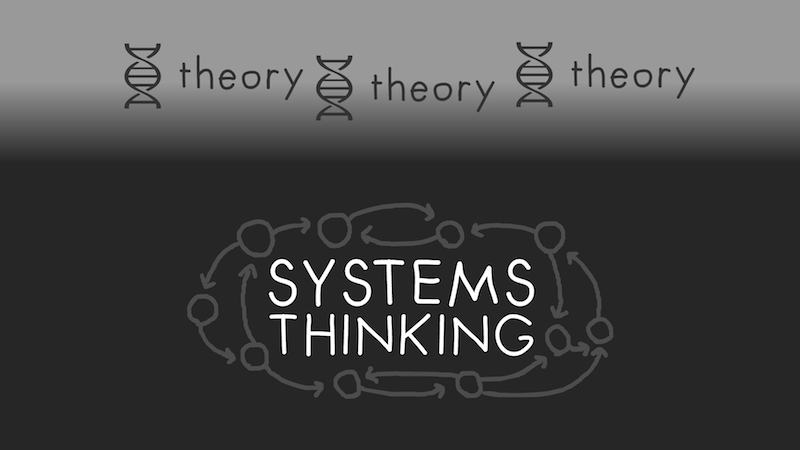
...SYSTEMS!
Systems Thinking. What is systems thinking? It's a broad and interdisciplinary field, and honestly it's a bit wibbly-wobbly, but here's what it is at its core:
Systems Thinking. What is systems thinking? It's a broad and interdisciplinary field, and honestly it's a bit wibbly-wobbly, but here's what it is at its core:
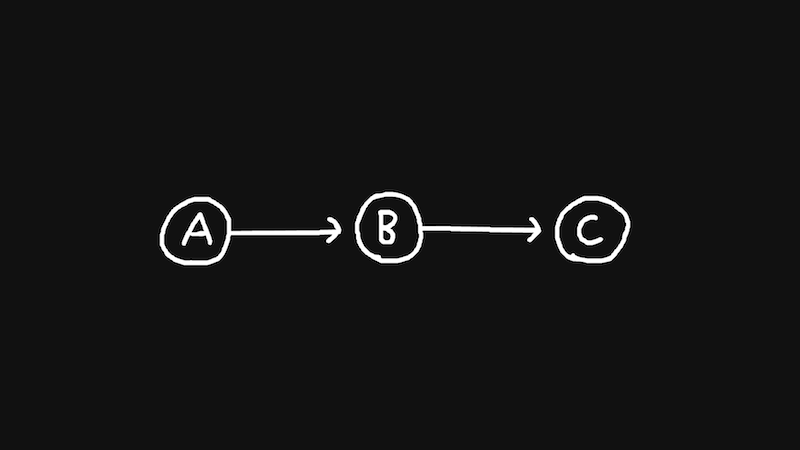
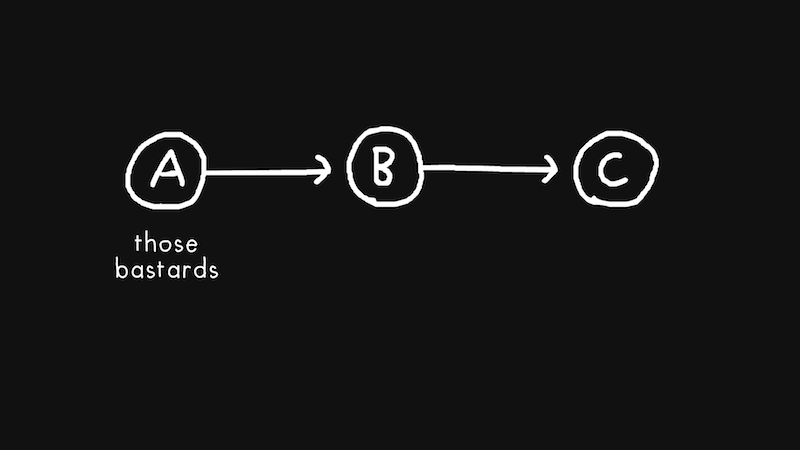
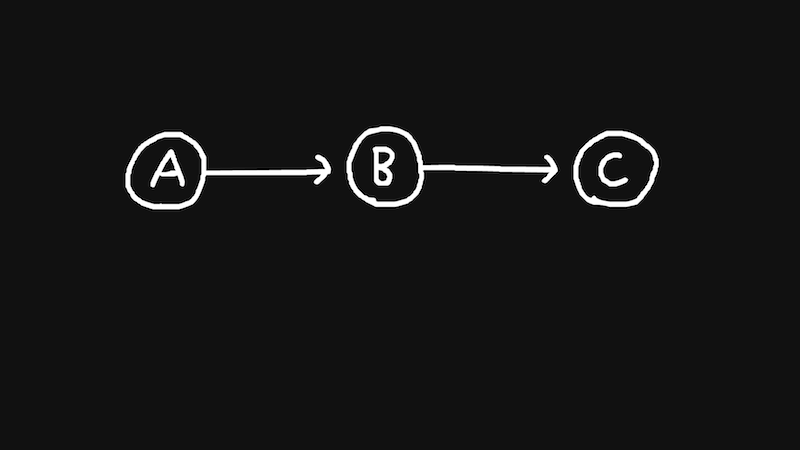
Normally, we see things as a linear chain of cause-and-effect.
A affects B affects C, and so on.
But what systems thinking says, is that the world is not linear...
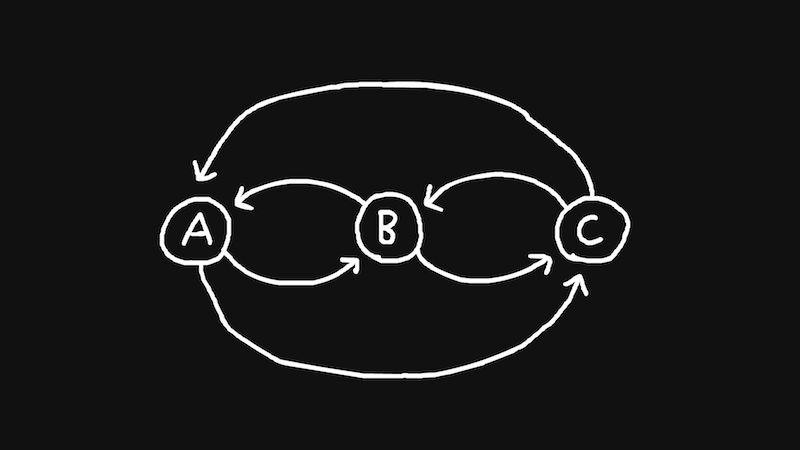
...it's LOOPY!
Vicious cycles, virtuous cycles, stabilizing and stagnating loops. A affects B, but sometimes, B can then affect A.
Vicious cycles, virtuous cycles, stabilizing and stagnating loops. A affects B, but sometimes, B can then affect A.
So the next time you want to teach someone something,
don't just stop at a single thing, a single story.
Dig deeper. Go after the system.
Because it's only once we understand the deep underlying systems...
...can we then get to where we really want to go.
PART B: (DIS)CONNECTED

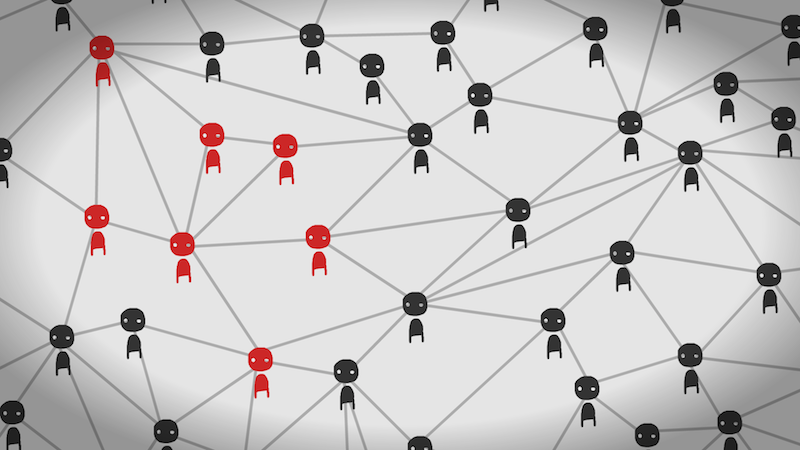
But even if we're informed, we can still have polarized echo chambers.
In fact, higher education correlates with higher partisanship, on both sides.
So how do we overcome polarization?
How can we create common ground between people with completely contradicting viewpoints?
To answer that, I'd like to show you a simulation I made one and a half years ago. It's an example of how systems thinking can combine contradictions.
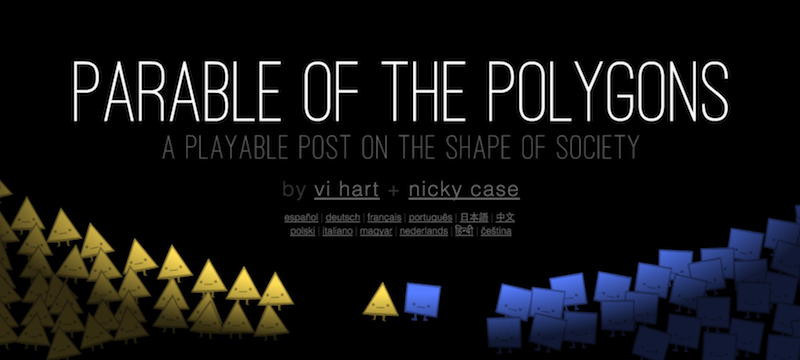
Parable of the Polygons,
an interactive blog post on discrimination and diversity.
Now, racism and sexism are very polarizing topics... especially on the internet... with several opposed, contradicting viewpoints.
One person could say, look at the racial ratio in our incarceration system, look at the gender pay gap, clearly there's massive societal discrimination.
But another person could reasonably respond, well I'm not a racist or sexist, and nobody I know is, and there's a huge taboo against being one. So even if we're slightly biased, it can't be as massive as you say.
Parable of the Polygons uses simulation to show something counterintuitive: it is possible for the collective to be highly biased, even if none of the individuals are.
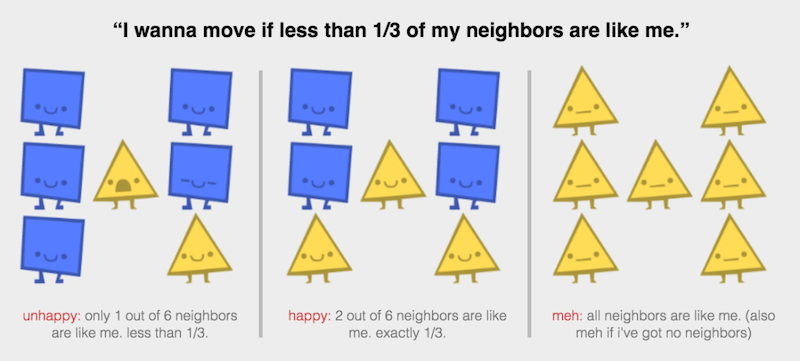
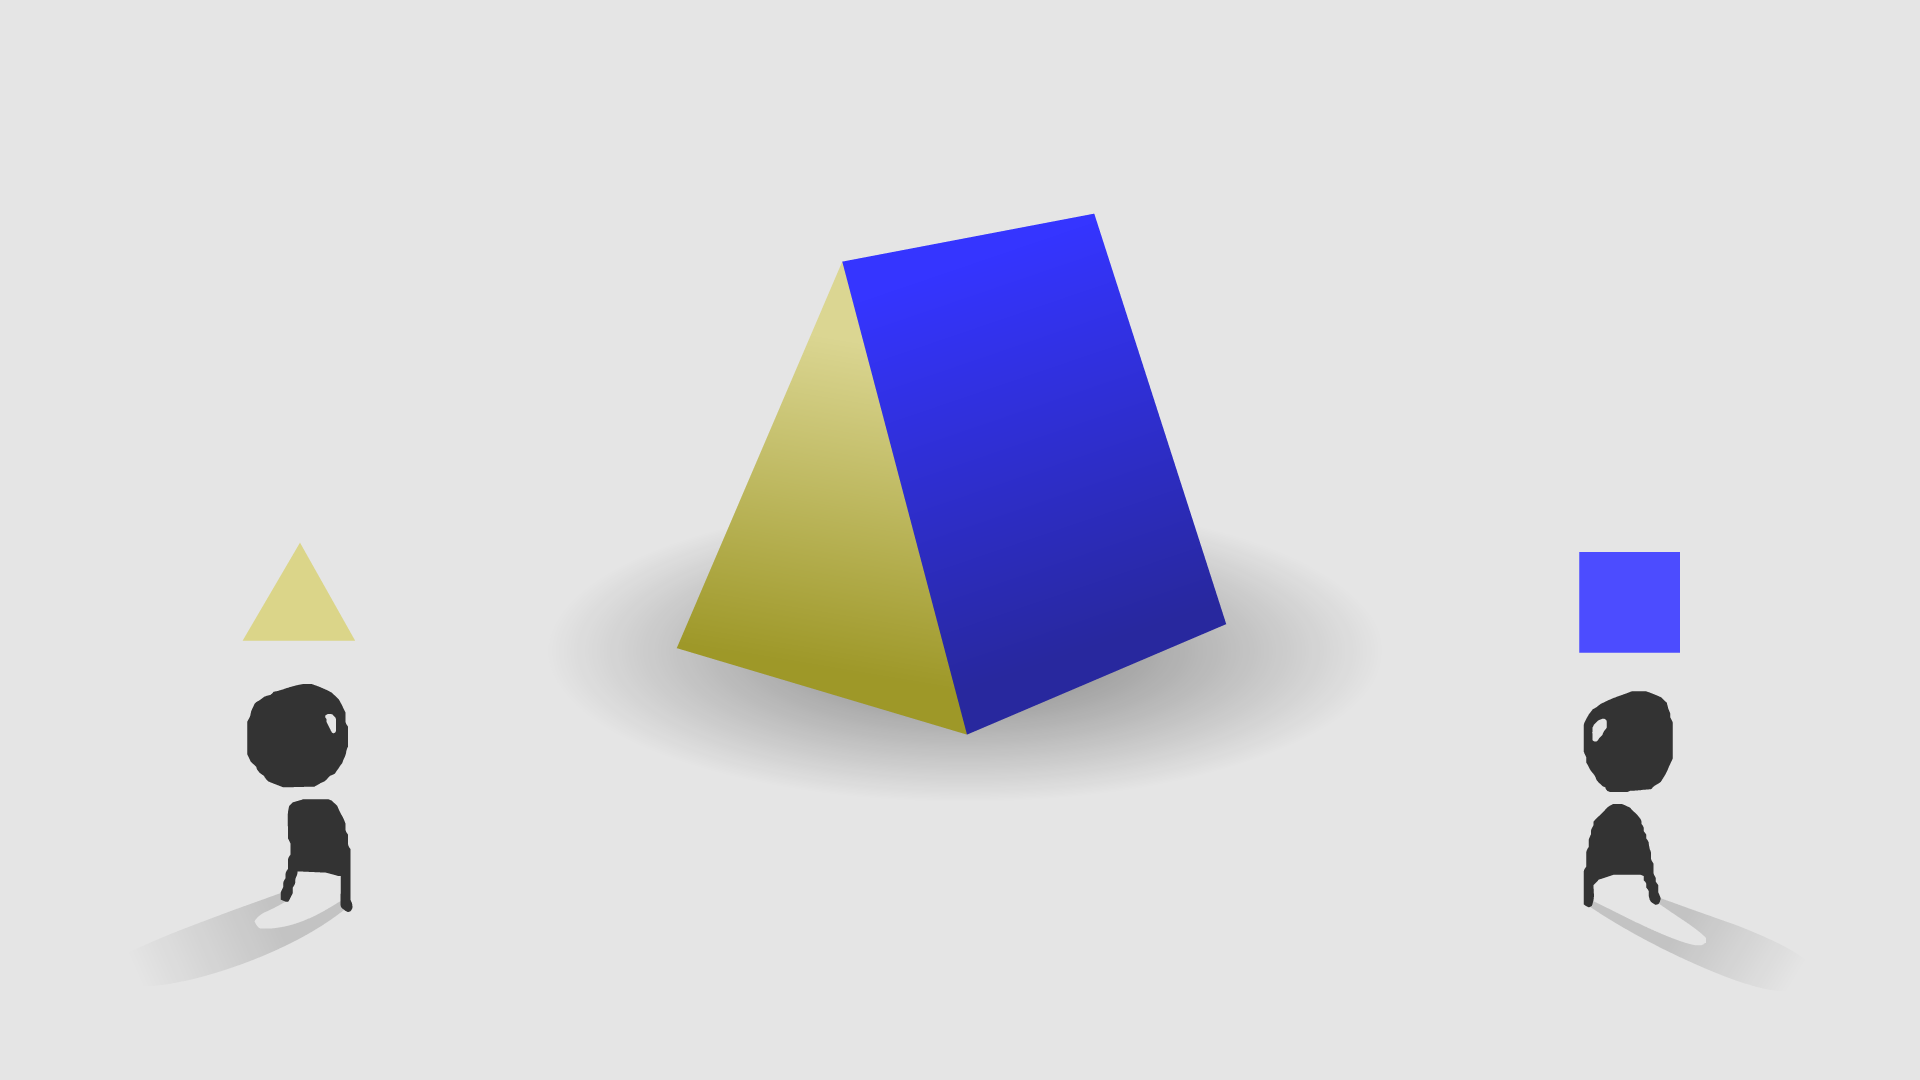
First, the Parable sets up the rules.
You, the reader, can move shape-people around a neighborhood.
Each shape thinks,
“I wanna move if less than 1/3 of my neighbors are like me.”
Note that every one of them would actually be happy being in the minority. There's no "massive bias" here.
“I wanna move if less than 1/3 of my neighbors are like me.”
Note that every one of them would actually be happy being in the minority. There's no "massive bias" here.
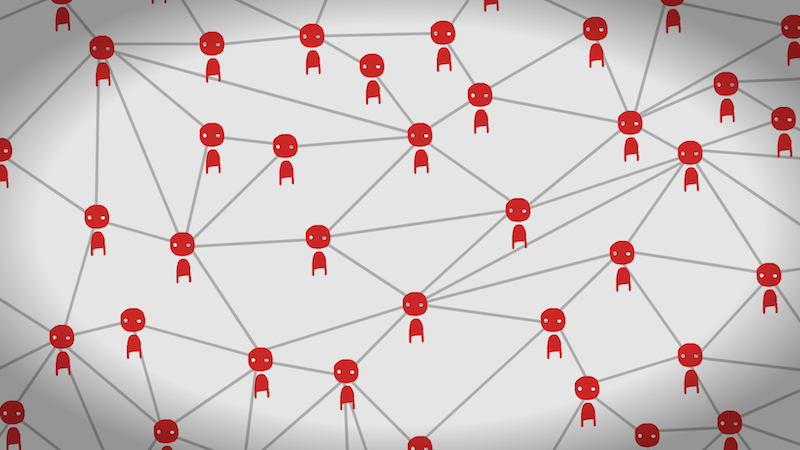
And yet, if we start off with a randomly mixed neighborhood of
triangles & squares, and you drag unhappy shapes to random empty spots,
without any foresight, what happens over time is...
this is a video! click play to watch what happens to the shapes
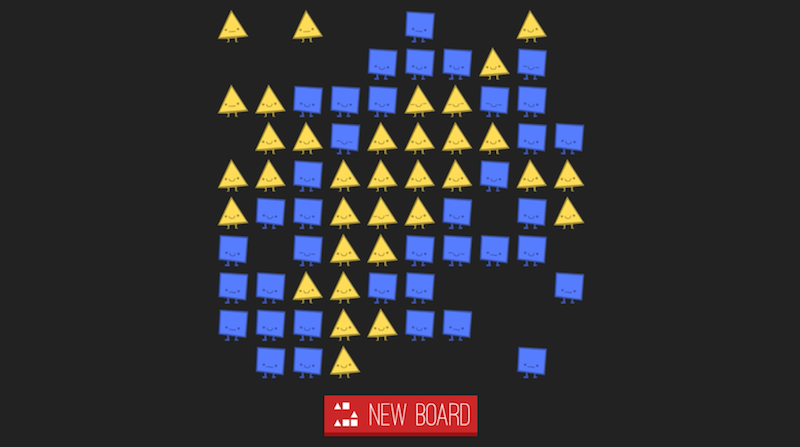
...complete segregation.
And the reader is not merely told this, or shown this, they create it for themselves, step-by-step.
And the reader is not merely told this, or shown this, they create it for themselves, step-by-step.

And that's how two seemingly incompatible ideas –
that most individuals have low bias,
and society collectively has high bias –
can turn out to be different perspectives on the same thing.
Two things I want to emphasize:
One, I'm not saying this is how discrimination always works. I'm just saying it's plausible, especially for bottom-up systems.
Two, this is not just “presenting both sides”. If you do that, the reader will just succumb to confirmation bias, remember the part that supports their beliefs, and forget the other parts. Instead, this is combining both sides – making it so you can't understand one argument without also understanding its opposite.
Systems combine contradictions.
get this as a high-res wallpaper!
Two things I want to emphasize:
One, I'm not saying this is how discrimination always works. I'm just saying it's plausible, especially for bottom-up systems.
Two, this is not just “presenting both sides”. If you do that, the reader will just succumb to confirmation bias, remember the part that supports their beliefs, and forget the other parts. Instead, this is combining both sides – making it so you can't understand one argument without also understanding its opposite.
Systems combine contradictions.
Let's talk about conflict.
Some conflict mediators are now using systems thinking to resolve conflicts. Here's how they do it:
Some conflict mediators are now using systems thinking to resolve conflicts. Here's how they do it:
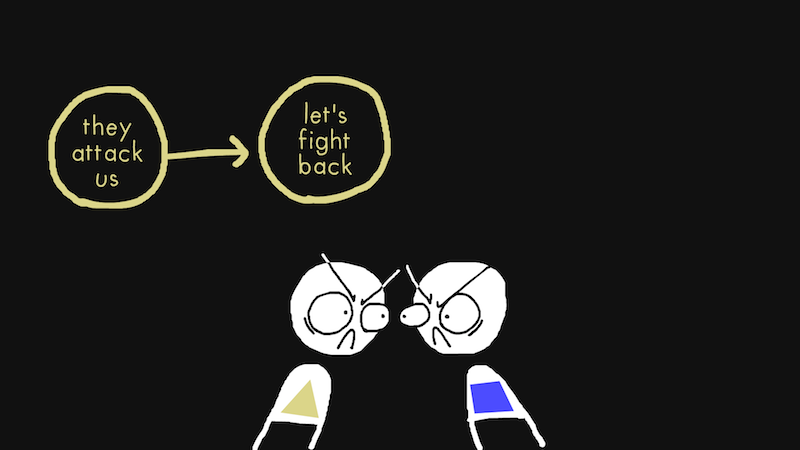
First, they get one side's story.
Usually it'll be a linear cause-and-effect story.
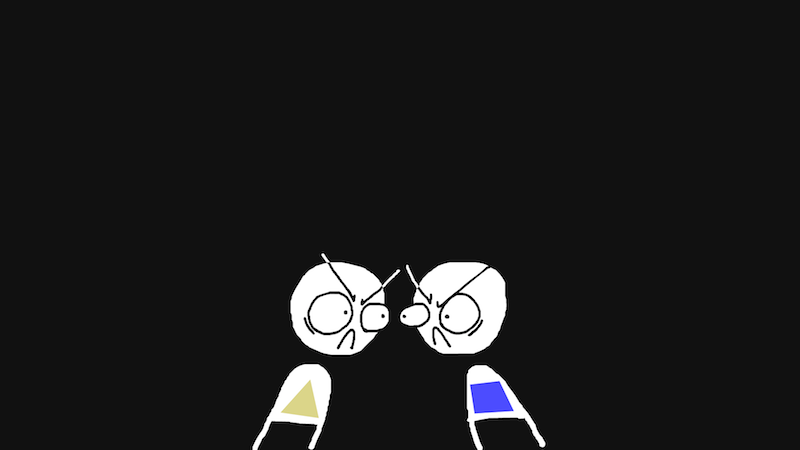
In this toy example, the story is
"they fought us, so we're just fighting back."
But the other side also has their own story.
Here, it's also
"they fought us, so we're just fighting back."
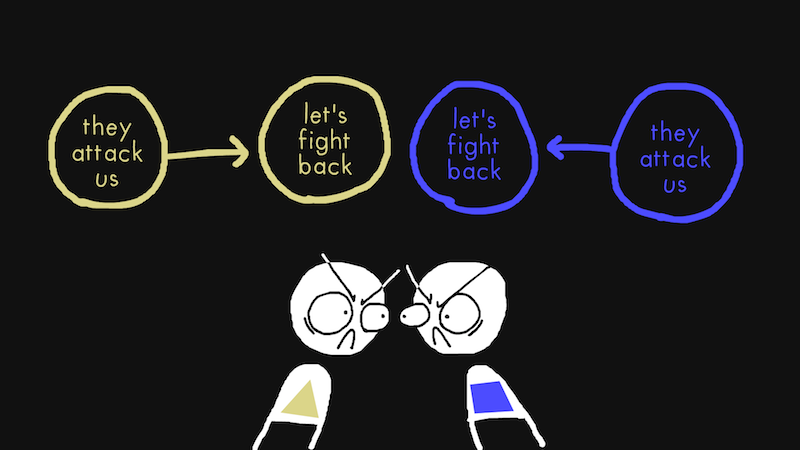
And what the conflict mediator will do is show that the story isn't linear...
And what the conflict mediator will do is show that the story isn't linear...
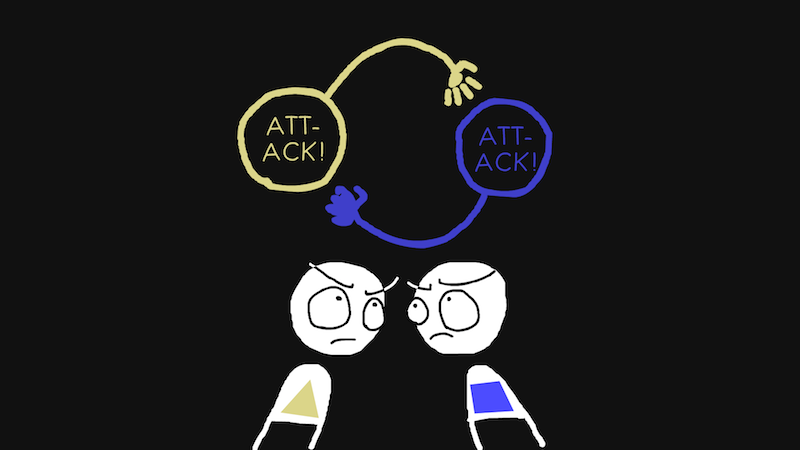
...it's LOOPY.
In this case, it's an escalation of violence, an arms race, a vicious cycle. That's a pretty common kind of loop for people to get stuck in.
The mediator then makes both sides recognize this. That they're both trapped in the system.
In this case, it's an escalation of violence, an arms race, a vicious cycle. That's a pretty common kind of loop for people to get stuck in.
The mediator then makes both sides recognize this. That they're both trapped in the system.
The system is their common enemy.
Not each other.
Then maybe, once they recognize the trap they're in, they can start working together to break out of it.
Not each other.
Then maybe, once they recognize the trap they're in, they can start working together to break out of it.
This might be where I would use the word, "empathy".
Now – I like empathy, I've made stories and interactives "for empathy", but it's, uh, getting to be kind of a buzzword. Not yet up there with "synergy", but maybe somewhere around "gamification."
But here's the problem with "empathy" – it's too individual. Yes, you need to first start with understanding the individuals, but it's more important to understand the systems. Good people can make a bad system.
If too much information makes us feel polarized, systems thinking reminds us we're all connected – for better or worse.
Now – I like empathy, I've made stories and interactives "for empathy", but it's, uh, getting to be kind of a buzzword. Not yet up there with "synergy", but maybe somewhere around "gamification."
[everyone laughs except for
the business people]
But here's the problem with "empathy" – it's too individual. Yes, you need to first start with understanding the individuals, but it's more important to understand the systems. Good people can make a bad system.
If too much information makes us feel polarized, systems thinking reminds us we're all connected – for better or worse.
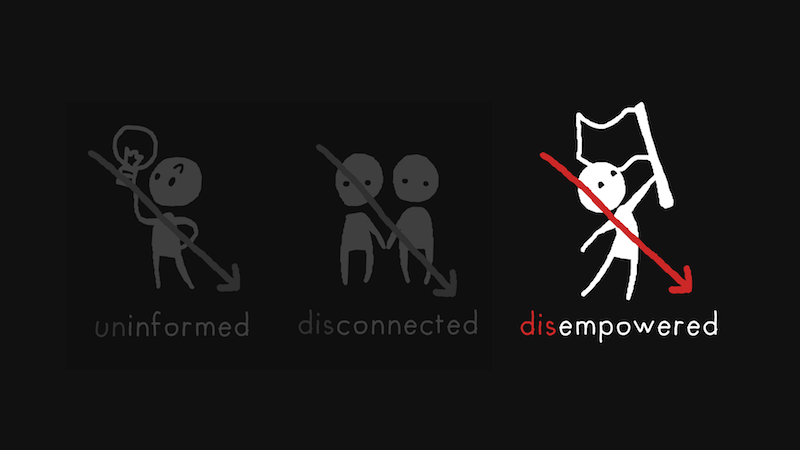
PART C: (DIS)EMPOWERED
But even if we're informed and connected,
we can still feel disempowered,
that we're all trapped in a system and can't do anything about it.
So how do we overcome that? And, well...
...I don't know. I was hoping I'd come up with an answer by the time I was scheduled to give this talk, but given that political philosophers have been tackling that question for millennia, maybe I shouldn't be too surprised.
That said, I'd like to give you my half-baked thoughts on "how do we empower peeps", in the form of a prototype:
This isn't out yet.
(It's online, but not officially "out")
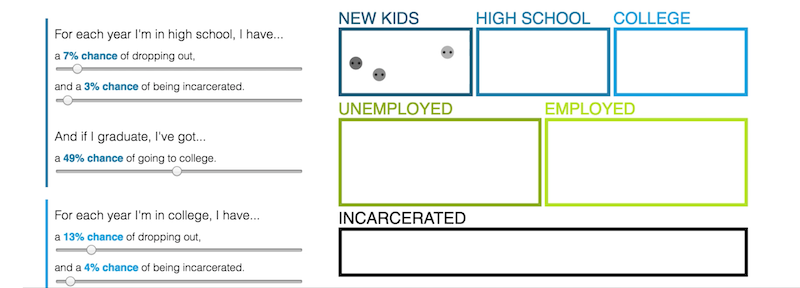
It's a prototype simulation of the US incarceration system,
extended to schools and employment.
So you have a bunch of boxes: students at the top, employed & unemployed in the middle, and the incarcerated at the bottom. Lil' simulated people move from box to box, randomly, with probabilities based off the real statistics on race, age, income, education, and incarceration.
And you, the reader, can change those probabilities, to try out different policies and scenarios. To ask "what if", and more importantly, "what can I do to affect this system?"
Let's run this simulation!
So, the people move from place to place, and you can also click an individual to focus on them. You can move back and forth between a single story, and the larger system.
And then, you can change probabilities for the box you most have control over. If you're a teacher, you can use this sim to ask "what if I helped more low-income kids go to college?" Or if you're a business-owner, "what if I reached out to hire ex-cons?" Or if you're a policymaker, "what if I reduced sentencing lengths?" From there, you can see what affect you could have on the whole system!
(You can't really see the effects in this prototype. That's why it's still a prototype. I'll figure out the interface eventually.)
this is a video! (the last video, actually) click to play.
So, the people move from place to place, and you can also click an individual to focus on them. You can move back and forth between a single story, and the larger system.
And then, you can change probabilities for the box you most have control over. If you're a teacher, you can use this sim to ask "what if I helped more low-income kids go to college?" Or if you're a business-owner, "what if I reached out to hire ex-cons?" Or if you're a policymaker, "what if I reduced sentencing lengths?" From there, you can see what affect you could have on the whole system!
(You can't really see the effects in this prototype. That's why it's still a prototype. I'll figure out the interface eventually.)

Here's the reason why I think people feel disempowered.
Because we tell ourselves a linear story about how power flows.
We think it all starts with the people on top,
the government or corporations, who control–
–the middlemen, the media, who control–
–an easily-manipulated majority, a gullible generation.
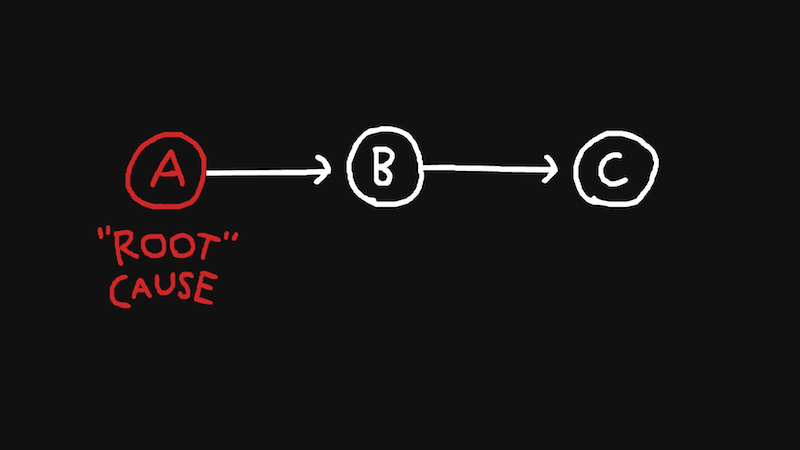
And in a linear chain of cause-and-effect, there can only be one root cause.
So in this story, if you're not at the very top of the hierarchy,
then you have no power to change the system.
But remember, the world's not linear, it's...
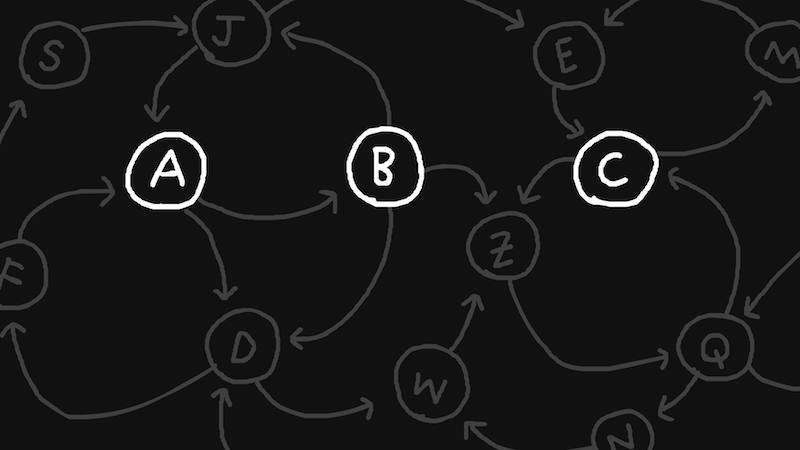
[audience shouts in unison: "LOOPY!"]
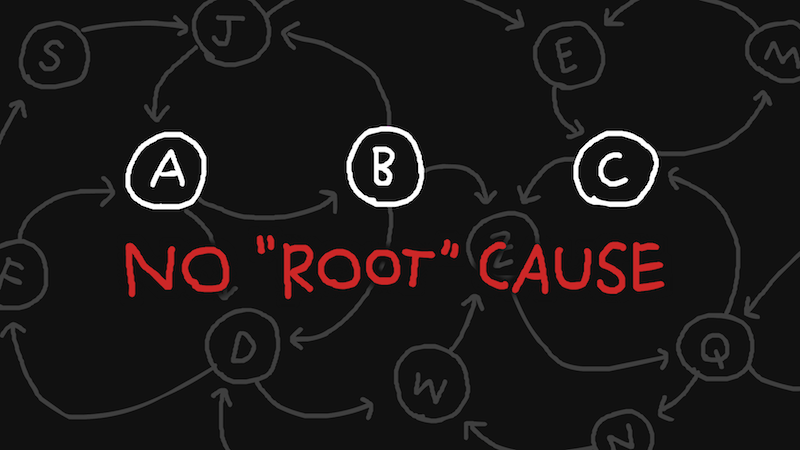
Yeah! Loopy!
And in a loopy system, there is no root cause. That's good. That means, no matter where you are in the system, what you do can have an effect, cycle through the loops, and ripple out through the entire system.
And in a loopy system, there is no root cause. That's good. That means, no matter where you are in the system, what you do can have an effect, cycle through the loops, and ripple out through the entire system.

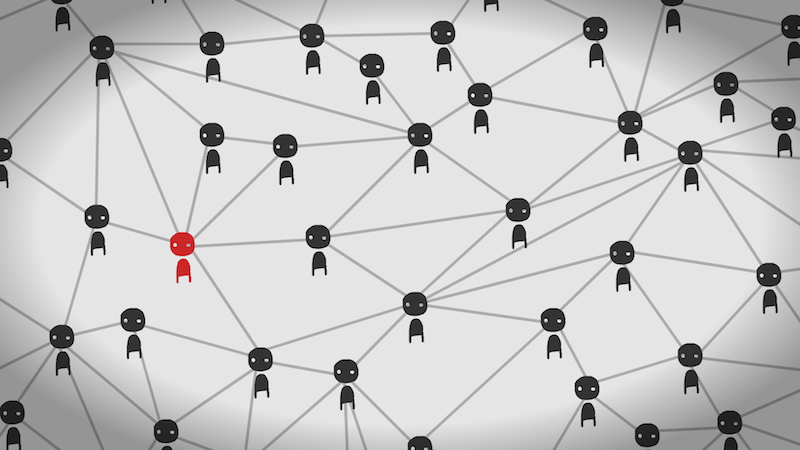
As Parable of the Polygons showed,
even small decisions within your local area
can profoundly impact the global stage.

So how can you change a whole system?
Well... you can't.
And frankly, you shouldn't.
No one person should have that power.
You don't "fix" systems. You can only influence and evolve them, so they can change themselves.
You don't "fix" systems. You can only influence and evolve them, so they can change themselves.
Let's make that more concrete.
For example, let's say you're a small business owner, and you decide to reach out and hire ex-cons.
For example, let's say you're a small business owner, and you decide to reach out and hire ex-cons.
And let's say it works out.
Then your peers in business see you're doing well,
and do the same for their businesses.
But just as you influenced your peer network,
the ex-cons have their own peer networks:
most likely people from poor, disadvantaged neighborhoods.
The ex-cons who are given a second chance in society,
can now influence and help out their at-risk friends.
And let's say this spreads and spreads, a virtuous cycle,
until public opinion on criminal justice changes.
And so, public pressure on politicians changes,
to force them into finally re-writing the laws.
In the linear story, change can only start at the top. But in this loopy system story, change goes from the bottom-up, and it's those at the top who are the last to change. And that's, maybe, how an individual can influence a system to change itself.
EASIER
SAID
THAN
DONE.
Again, and I cannot stress this enough, these are all half-baked thoughts, I don't have the answer, nobody has the answer, maybe nobody will ever have the answer.
But systems thinking is powerful.
It can help us
understand things on a deeper level,
overcome polarization and work together,
and maybe – just maybe – it can help us change the world!

. . .

So what.
I just gave you a whole bunch of theory, and not a lot of practical takeaways. You may be saying...
Nicky, I got deadlines after this conference. I gotta learn D3. I'm only up to D2.
...so what do ya gots for me?
I just gave you a whole bunch of theory, and not a lot of practical takeaways. You may be saying...
Nicky, I got deadlines after this conference. I gotta learn D3. I'm only up to D2.
[laughter disguising the fact that
some of them probably *do* need to
learn D3.js for a looming deadline]
...so what do ya gots for me?
Well I'm glad you asked, hypothetical person,
because now I'm gonna give you some practical tools
to tell stories about systems, and systems about stories!
So, here are...
So, here are...
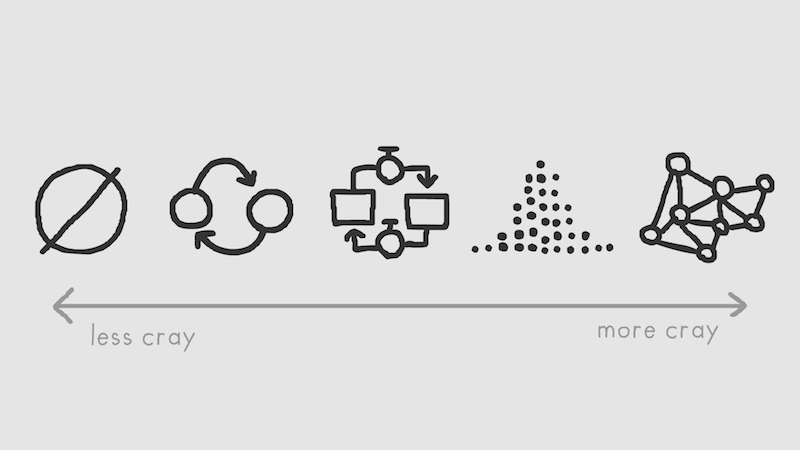

And the first tool is...

...nothing.

Or, at least, nothing new.
You don't need simulations or interactivity.
Because while it's still rare, people have successfully
told stories about systems in other media!
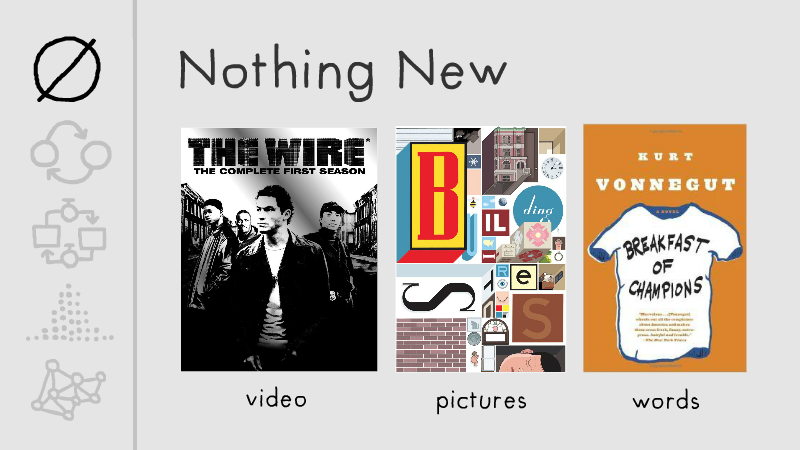
The quintessential example of system-storytelling is The Wire.
Each season is from a different perspective, a different part of the Baltimore criminal justice system.
So if you make video or film, definitely check out The Wire.
Alternatively, if you make infographics or other visuals, check out Chris Ware's graphic novel, Building Stories. It's not a story about a system, but it's still got nonlinear narrative. Multiple perspectives across different points in time, told through the grammar of comics. It'd be great to see these devices used to visualize real-world systems!
And of course, there's books. You can take inspiration from "postmodern" literature like Kurt Vonnegut's Breakfast of Champions or – one novel I read recently, not pictured here – Jennifer Egan's A Visit from the Goon Squad. These novels use ensemble casts, because as we now know, a single perspective – a single narrative – is not only limiting, but possibly inhumane.
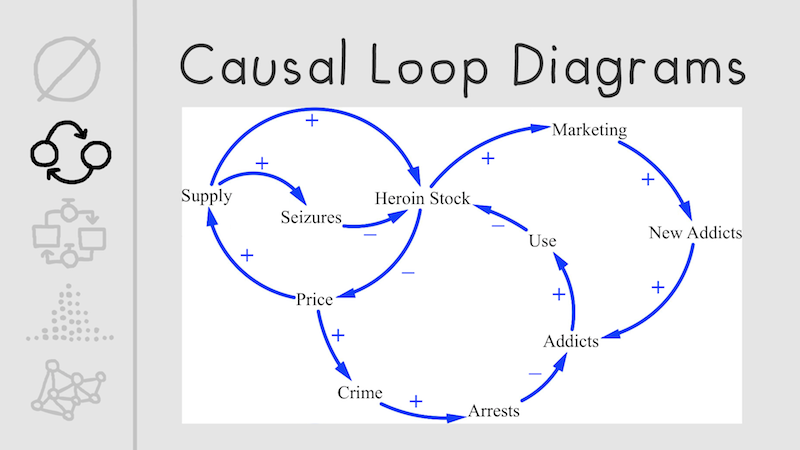
The second tool is what I've been using for this entire talk:
Causal Loop Diagrams.
Basically, words and arrows. You draw whether A causes more or less of B, and the feedback loops. This picture you're seeing here is my favorite example, about the war on drugs. Specifically, heroin. I love this example so much because it's three whole stories about different parts of a system, compressed into one loopy picture.
The 1st loop, on the top-left, shows that: Seizing heroin → reduces heroin inventory. Duh. But in the longer run, reduced inventory → increased price → increased profits → increased incentive to create even more heroin. And so on.
The 2nd loop also shows that: increased price → more petty crime and theft (since addicts physically need to support their addiction) → more drug addicts are arrested (which adds to our mass incarceration problem) → fewer drug "customers" around → drug dealers get an excess inventory of heroin.
The 3rd and final loop shows that: Excess inventory of heroin → Dealers do more "marketing", pushing heroin onto at-risk youths → More new addicts are created.
Those three loops could fill up three whole documentaries, but the Causal Loop Diagram can capture it all in one picture! I'd love to see you designers use this tool, because... honestly, all the causal loop diagrams I've found make my eyes bleed, and they could use your design skills.
Like, look at this slide. Apparently academics don't know there's more fonts than just Times New Roman, and more shades of blue than hex code zero-zero-zero-zero-eff-eff.
[pained sympathetic laughter]
Now we're getting into simulations!
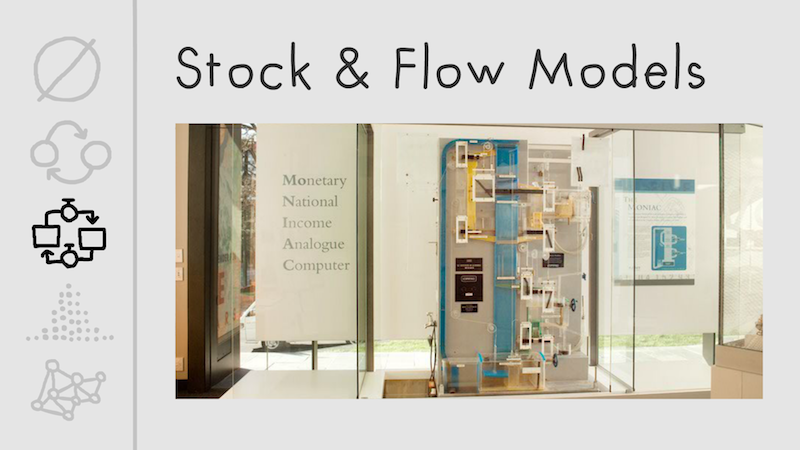
The third tool is the Stock & Flow Model.
Think of a bathtub. A bathtub is your "stock", and water "flows" in and out.
Now, the earliest simulation I could find of a Stock & Flow Model was not on an electronic computer, but a water computer. This is the MONIAC. Instead of electricity flowing through wires, it's got water flowing through pipes. It was invented in 1949 by some New Zealander economist, to simulate the UK economy. For example, the treasury is a bathtub, and money flows in and out. And so on.
And many researchers today also use stock & flow models. Climate scientists model CO2 flowing in and out of the atmosphere. Social scientists measure immigrants flowing in and out of a country. Basically, if you have any thing where things flow in and out of that thing, you can use this tool to simulate it!
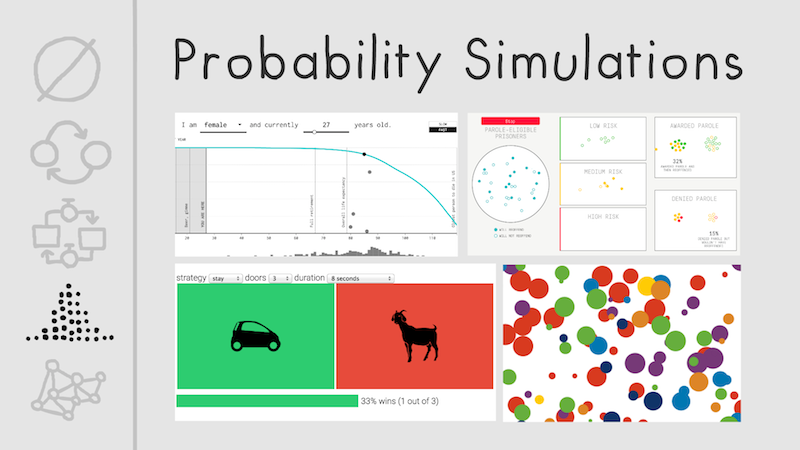
The fourth tool is Probability Simulations.
The dataviz community is actually already making a lot of use of this!
And so I'll just go through a few examples:
Years You Have Left to Live by Nathan Yau, which uses real CDC stats to simulate copies of you being born and dying... over and over... a hundred times per minute. Yeah that's kinda dark.
Parole Simulator by The Marshall Project & FiveThirtyEight, which puts the reader in control of deciding what the risk cutoff rate should be for parole. The reader has to make that tradeoff.
Monty Hall Paradox Explained by Victor Powell, which demonstrates the infamous mathematical paradox, via simulation.
Rock n' Poll by Maarten Lambrechts, which uses simulations to explain what "margin of error" is, and why a 2% change in polling results isn't worth analyzing.
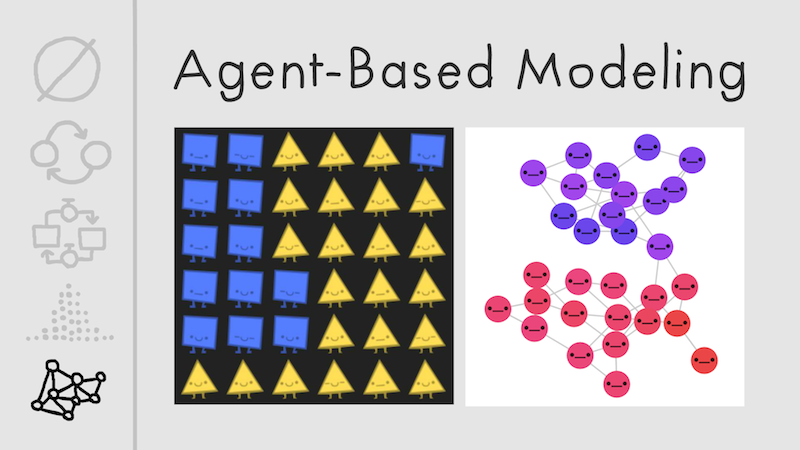
Finally, on the deep end of the theoretical pool,
we have Agent-Based Modeling.
Basically, an "agent" is a thing that makes decisions, and an agent-based model is several agents making decisions based off each others' decisions. Lots of loops.
Parable of the Polygons uses an agent-based model from Thomas Schelling, a Nobel Prize-winning economist. These models don't have to be grid-based, they can also be a network – like social networks, economic networks, or political networks.
Agent-based models also have practical uses. They're used to design fire escapes, by simulating how crowds flow, and to design public health campaigns, by simulating how an epidemic can spread.
See? SIMULATIONS SAVE LIVES.
Anyway, now that you know the theory and tools, without further ado, I present to you...


...Step 1.
Pick a thing. A specific individual's story you want to tell.
You have to start with a human story, because that's the emotional hook
that'll make people care, and the concrete case for your abstract system.
But don't stop there. Go deeper to...
But don't stop there. Go deeper to...
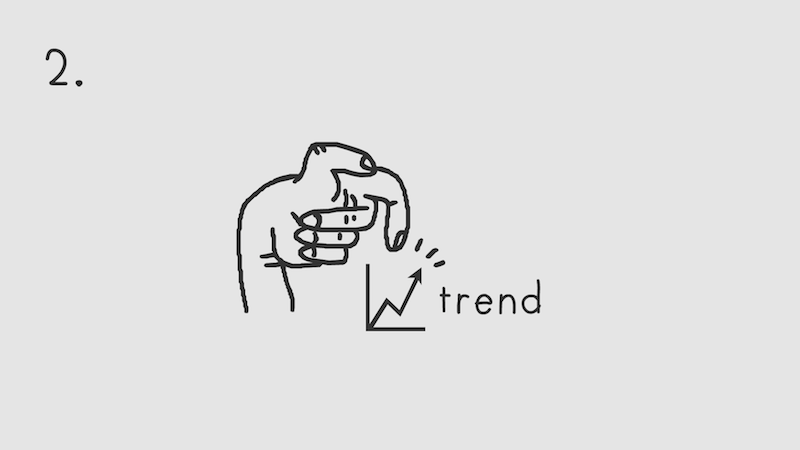
Step 2: the trends. The underlying patterns that your story is a part of.
Then go even deeper, to...
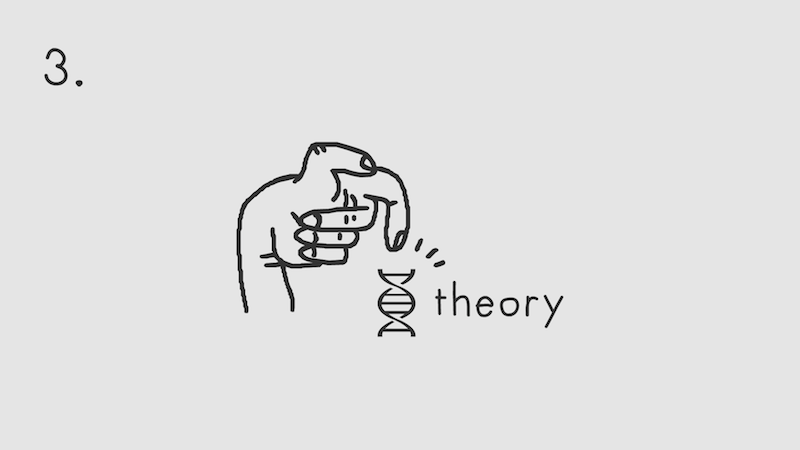
Step 3: the theory. Why the patterns are the way they are.
You don't need to be an expert, but just figure out enough to understand...
Step 4: the cause-and-effect loops.
Like a street map, you can't and shouldn't consider every possible thing,
but just get down what your core loops are.
Once you have that...
Step 5: pick the tool that works best for you, to tell the story of this system.
And once you have a prototype...

Step 6: iterate on that prototype. Then...

Step 7: iterate on that prototype. Then...

Step 8: iterate on that prototype. Then you just
keep doing that for a while, until you've made something wonderful that really...
informs people,
connects people,
and empowers people, and once you've done all that...

Step 134... ship it!
And step 135, fix some bugs.
Thank you all so much!
 If you like the shtuff I make, feel free to
follow me on Twitter,
or
throw monies at me on Patreon. Thankies!~
If you like the shtuff I make, feel free to
follow me on Twitter,
or
throw monies at me on Patreon. Thankies!~
 All my slides & words are dedicated to the public domain.
You can grab the source here,
and use it however!
All my slides & words are dedicated to the public domain.
You can grab the source here,
and use it however!
P.S – Stuff I Didn't Mention In My Talk, But That You May Still Wanna Check Out:
[APPLAUSE]
If you like the shtuff I make, feel free to
follow me on Twitter,
or
throw monies at me on Patreon. Thankies!~
All my slides & words are dedicated to the public domain.
You can grab the source here,
and use it however!
P.S – Stuff I Didn't Mention In My Talk, But That You May Still Wanna Check Out:
- Thinking In Systems (book)
- Media for Thinking the Unthinkable (talk)
- Explorable Explanations (wobsite)