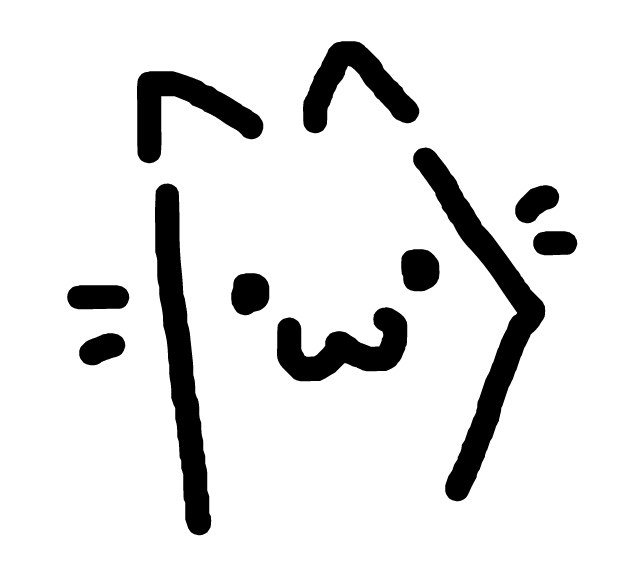
Gonna use a classical coin as an analogy, since: 1) like a bit, it's a two-state object, 2) like a qubit, it's "random".
A coin heads-up could be written |0〉
A coin tails-up could be written |1〉
And a coin spinning on a table could be written as a "superposition" as both, with amplitudes 1/2 to represent the 50-50 chance:
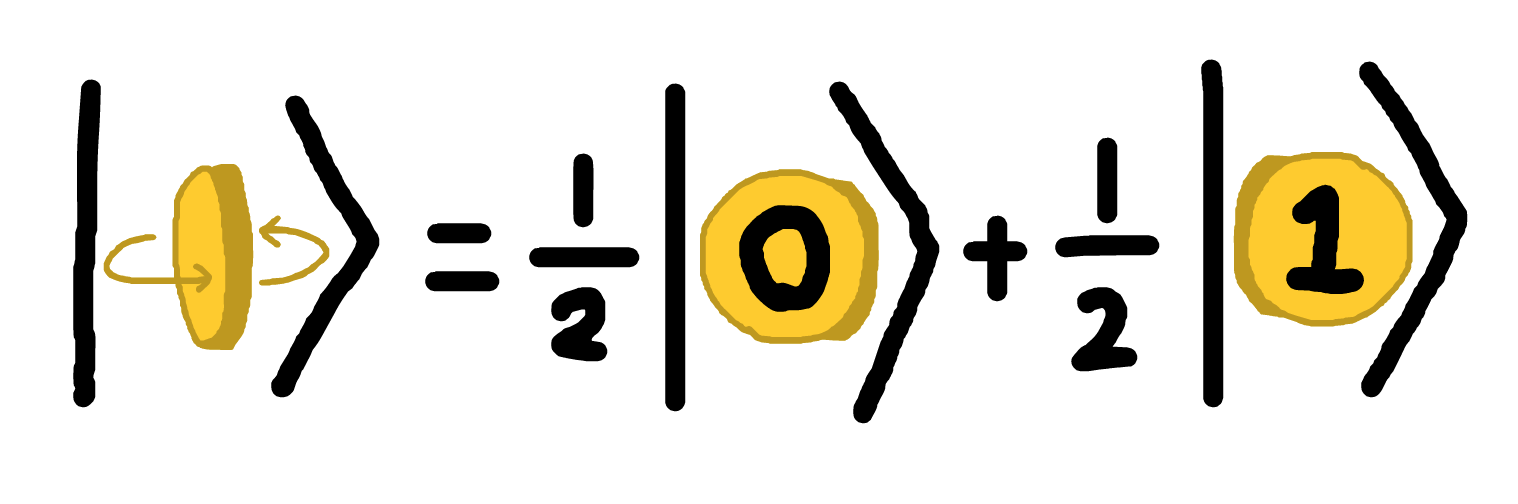
(note: I really liked how in Quantum Mechanics for the Very Curious, the authors de-hype-ify "superposition" by just explaining it's exactly synonymous to "linear combination")
Other noteworthy thing about the spinning coin: to measure it, you slap it on the table, forcing it into the |0〉or |1〉state. That is: measurement is not gentle. In QM, measurement changes the state.
However, in QM, the amplitudes can be negative, or even imaginary. What does that mean?
For the rest of the explainer, I'll represent complex numbers as arrows:
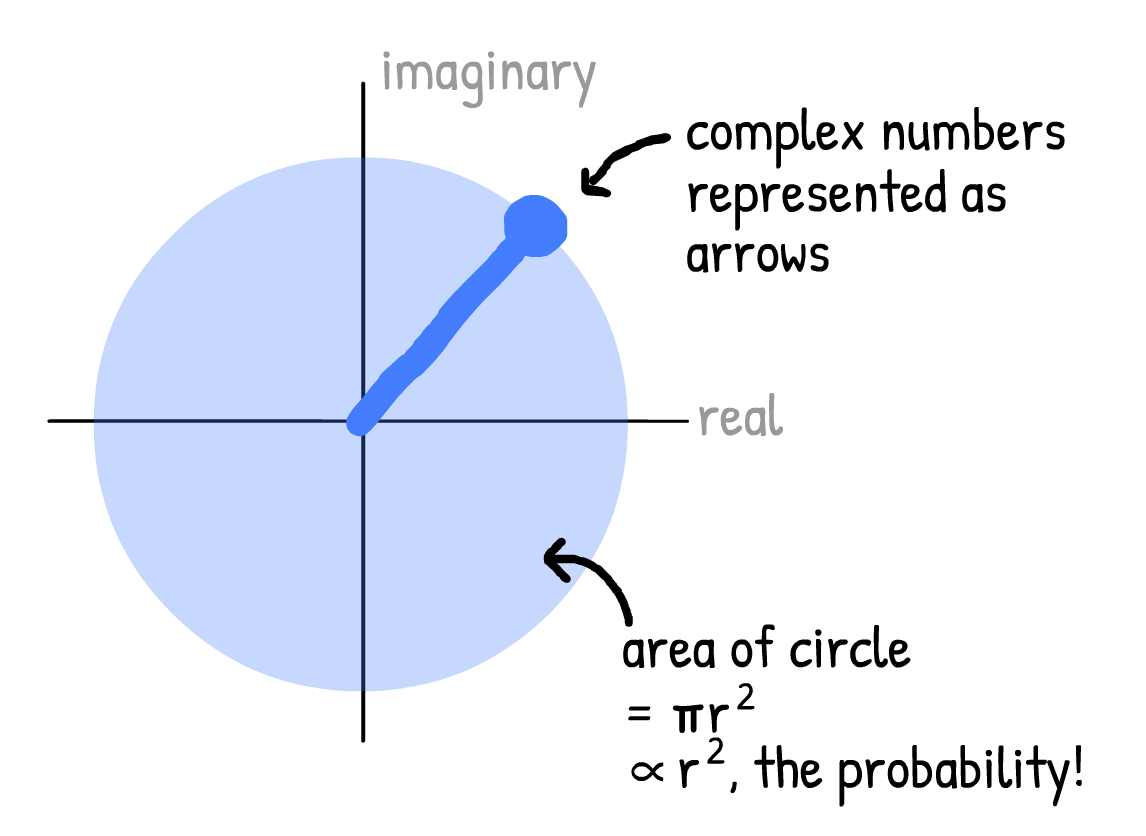
Conveniently enough, the area of the circle is pi*r^2, which is proportional to r^2, which is the probability of getting that state when you measure it!
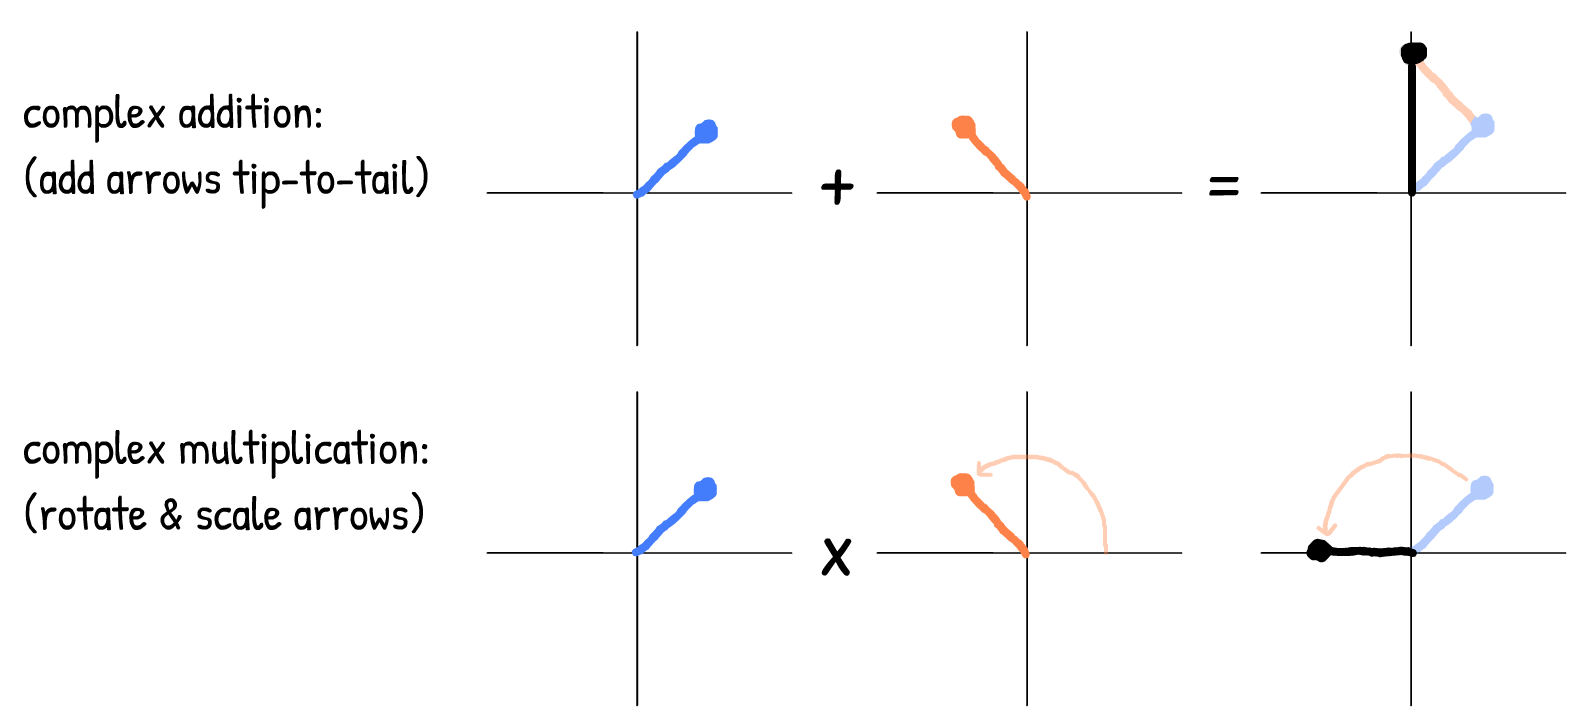
Addition is simply gluing arrows together, multiplication is scaling & rotating arrows:
So that's how you represent the two amplitudes in a quantum state. However, it's a bother to write |ψ〉= a|0〉+ b|1〉over and over again. Not to mention harder to do addition & multiplication that way.
So, let's introduce two new mathematical tools: vectors and matrices.
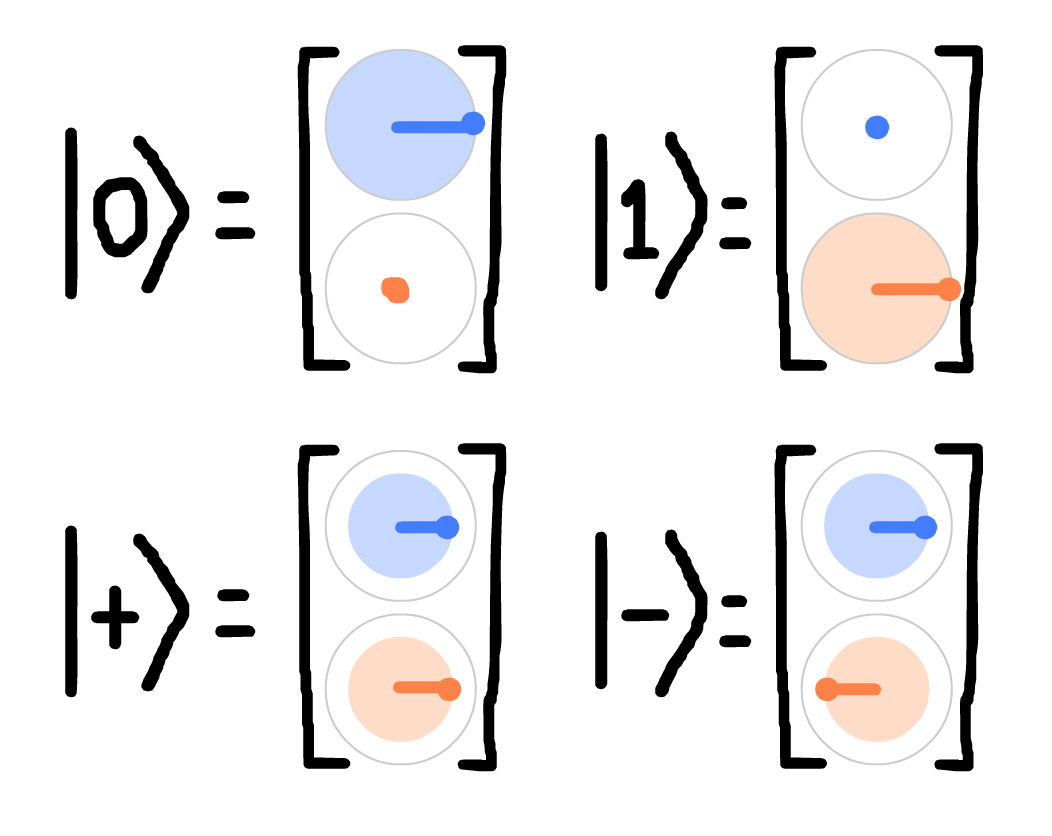
Some famous QM state-vectors:
Here's how the Hadamard matrix is able to distinguish between the |+〉and |-〉states, even though they have the same probabilities:
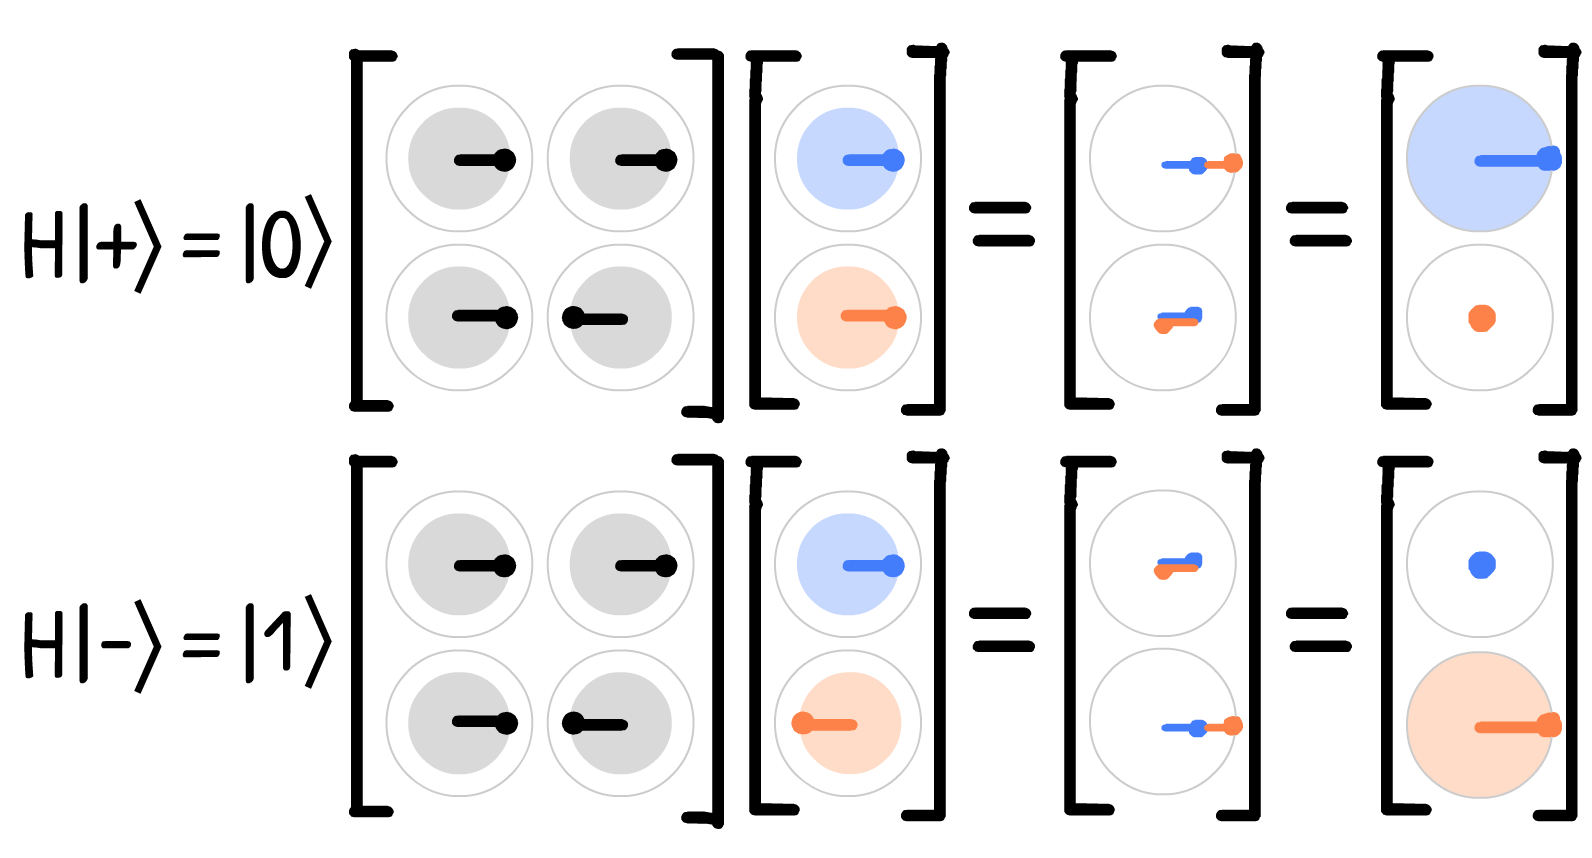
Note how the arrow-visualization shows the constructive & destructive interference!
(Before I made this visualization, I didn't really understand how the Hadamard gate worked. Drawing this was a big "aha!" moment that, in fact, inspired me to outline this whole dang thing)
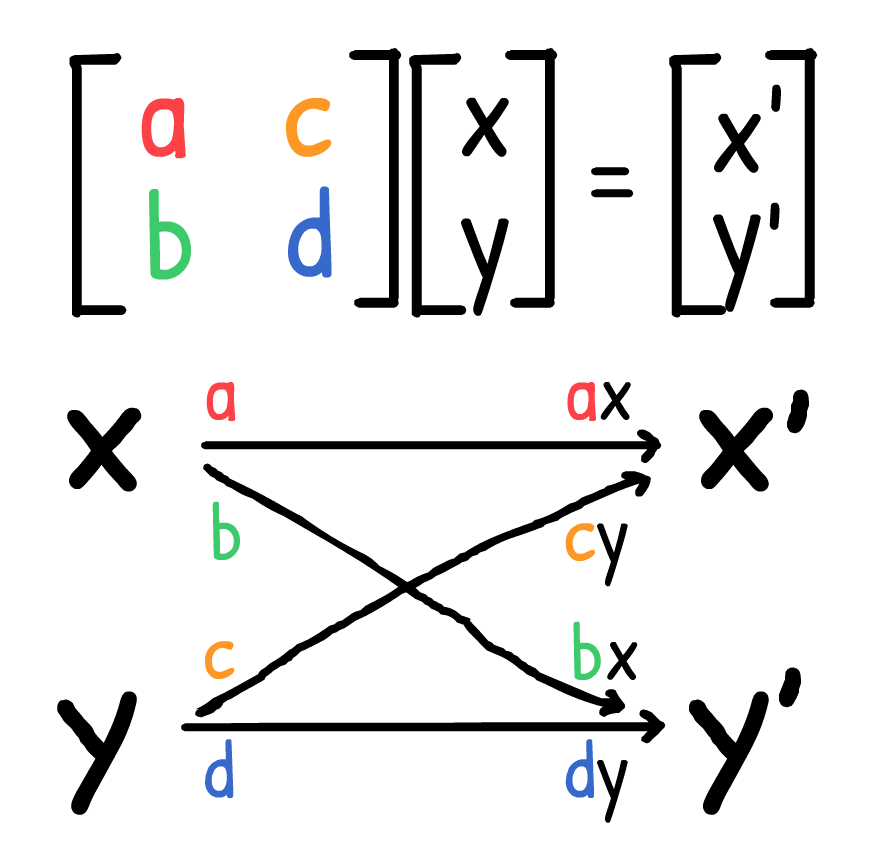
Need to figure out how to better-order this section, but I'd also like to introduce this useful visualization for matrices (inspired by this blog post)
It turns out, you can visualize matrices as a weighted bipartite graph:
And if you visualize the connections according to these rules...
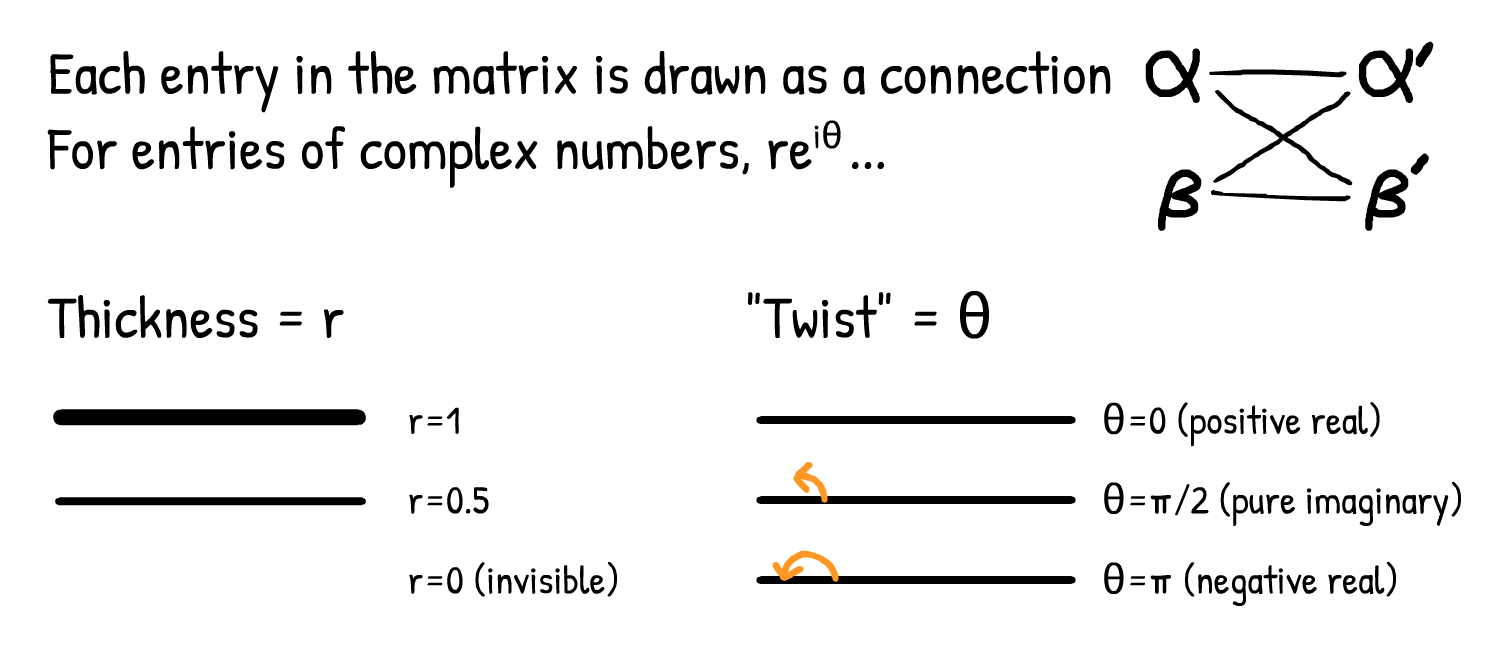
It makes these famous QC gates / matrices look like this:
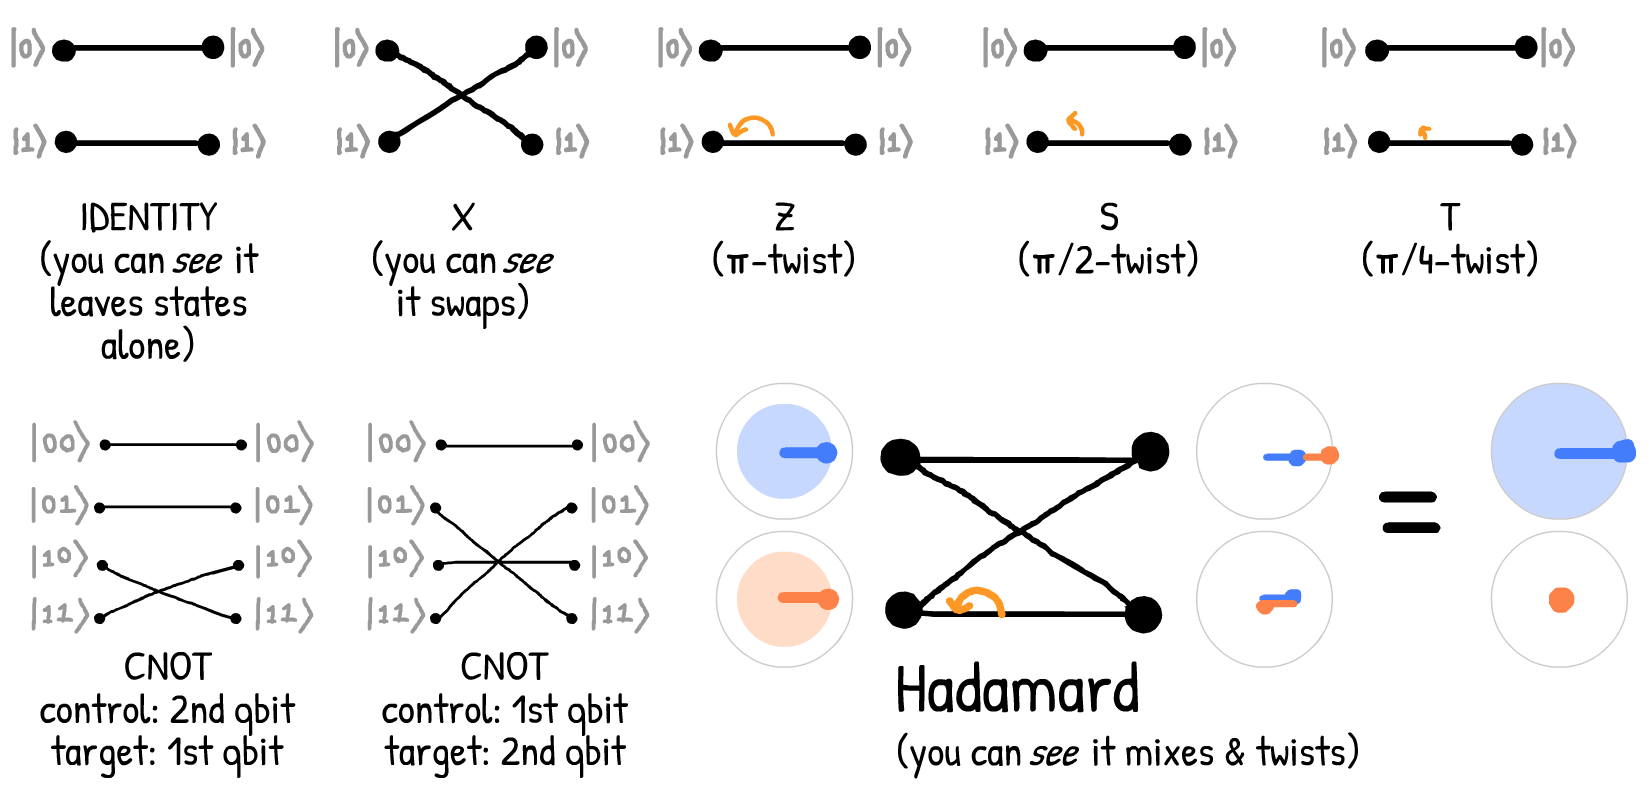
So as you can see, this graph-visualization of matrices makes it much more apparent what the gates/matrices do to the state-vector.
But this next visualization was what really sold me. So, apparently, you can swap the state of two qubits using three CNOTs. (analogous to the XOR swap) It was not obvious to me why this was the case, even after multiplying 3 matrices corresponding to the 3 CNOTs.
But! When I visualized it with the graph method, it was now obvious. Just follow the paths, and you'll see how it works!
|00〉=> |00〉
|01〉=> |10〉
|10〉=> |01〉
|11〉=> |11〉
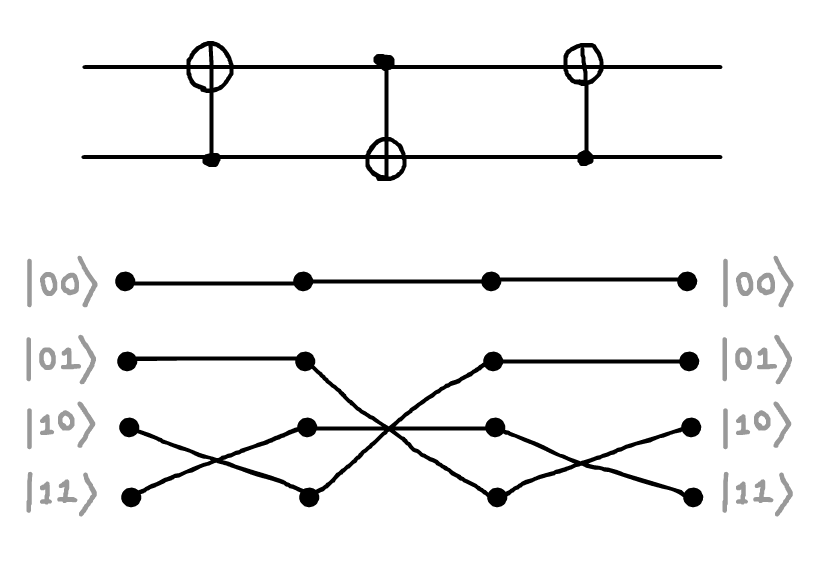
(note that matrix multiplication simply becomes gluing the graphs together. also note that, unlike regular matrix multiplication, it's actually freakin' left-to-right.)
Will have some kind of simulation (puzzle game?) of quantum circuits visualized like this:
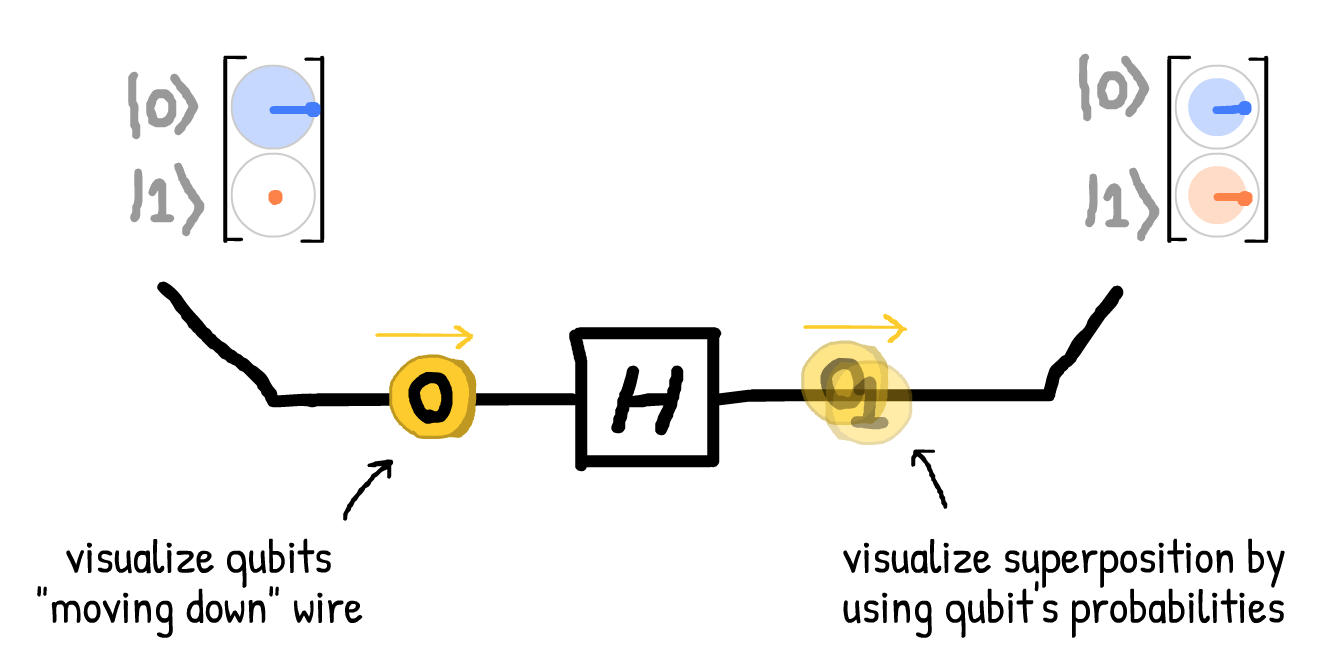
(In the full visualization, I'll also show the matrices-as-bipartite-graphs. Did not do so here, coz I forgot)
Here's a circuit with two qubits, entangled to create a Bell's state:
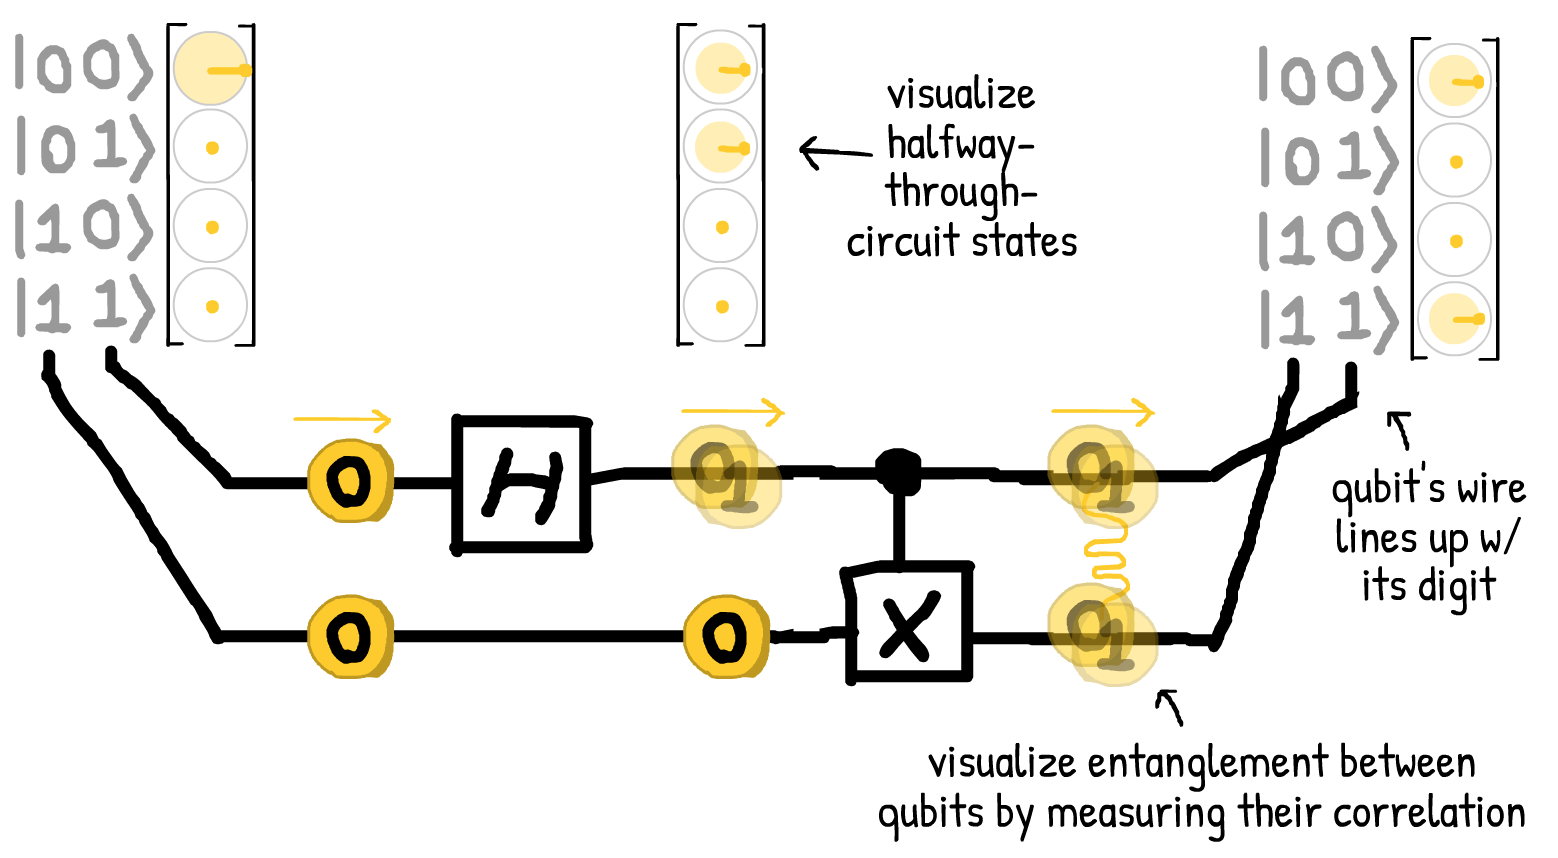
Note that in the final state-vector, the circles' area corresponds to the probabilities of measuring that state! Above: a 50%-50% chance of measuring |00〉or |11〉
Try to explain Grover's, Quantum Teleportation, Quantum Fourier Transform, and – maybe, maaaaaaaaaaybe a very high-level hand-wavey explanation of Shor's Algorithm??